question

What modulates our Sun? The majority of science work on the principle that the Sun is self modulating and each solar cycle is a product of a random number generator. There are others that suspect the Sun is modulated by the planets with a special emphasis on Uranus & Neptune. Thanks to Carl Smith who has recently left us we have new knowledge that significantly adds to Jose, Landscheidt & Charvàtovà's work.

Geoff Sharp

Solar Pole Strength Graph.

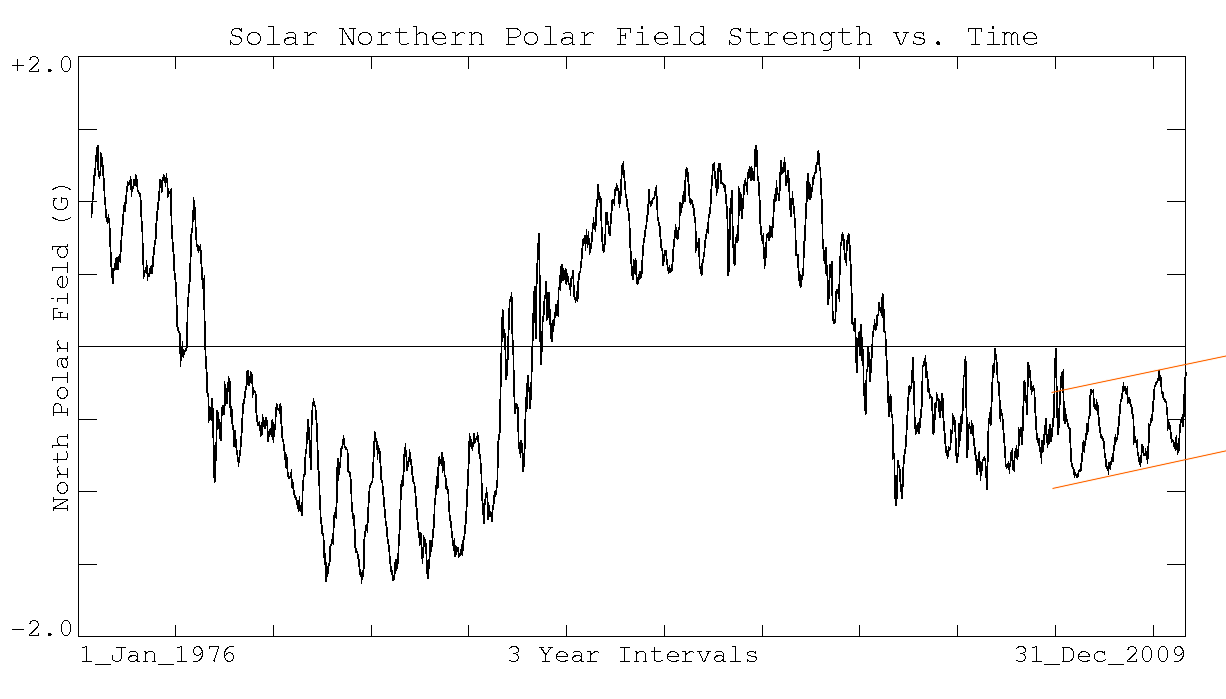
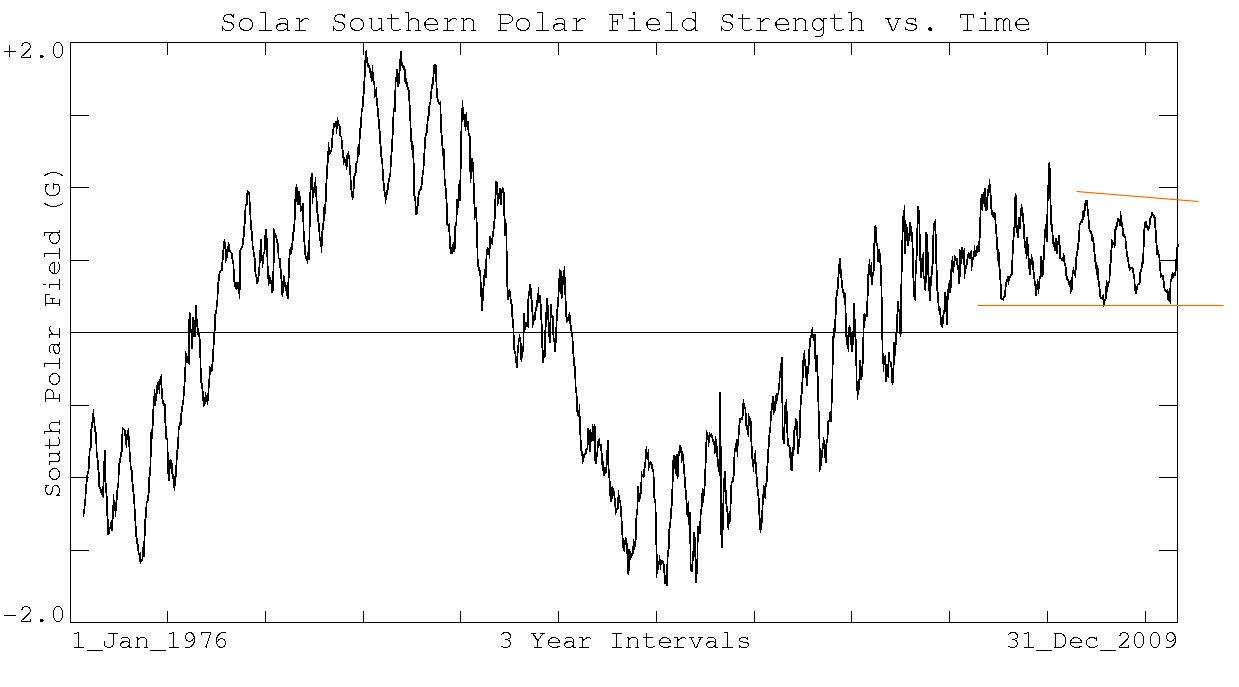
Click on the graph to get a full size view, it is also an updating image directly from the WSO as information comes to hand. But at the present it is showing a very unusual trend and a continuing low strength. How long can it stay flat for?

The Babcock-Leighton theory suggests the poles get their strength from random "flows" that happen to make their way from their original sunspot position to the poles. Others still suggest this buildup of strength is then used in the next cycle. This theory has little previous data to support its claim and has problems explaining SC20, if we do indeed experience a solar grand minimum during SC24, the theory will be trash.. My thoughts are the pole strength is the end result of Dynamo activity that is shaped by Angular Momentum, the power comes from within not from the poles and the graph is a representation of the cycle itself.

The above graph is suggesting that we still don't have a lot of flux flowing towards the poles. The Sun is in a Funk, I wouldn't be surprised if this measure turns out to be the most important pin up graph of the grand minimum.

UPDATE: Feb 14, 2010.

The pole strength is measured at both poles independently and the data is also graphed separately on the WSO site. There is an interesting trend happening with the Southern Hemisphere right now which is suggesting it is behaving differently from the Northern Hemisphere. In the graphs below it can be seen from the baselines that the North is starting to head for a polarity reversal, but as yet the south is remaining flat. This will be very interesting to watch.


Comments

Good job on this site Geoff. 

Good job on this site Geoff.  Smile

Just my opinion ..

What do the Planetary Theorists Cult, L&P Effects Cult and the Interstellar Medium Cult all have in common?

Low solar cycle 24 with continued low cycles into the future.

What is the cause of solar cycle variations?   All  3 above???

Well that's where it's at.  

Happy Friday. 

Again,  nice site Geoff.


Thanks

Thanks Carla, there is a core group of us that suspect something is up. That includes many with great credentials, the "crap shoot" theory is just hanging in there right now. The next 6 months might show us all there is an external solar driver.

Angular Momentum Calcs in 3D?

To me, the northern and souther hemispheres behaving differently suggests that the mass of the sun is more north or south of the center of mass of the solar system than is typical. Have you done the angular momentum calcs in 3D as well as 2D?

Z factor

A great question steve, I have looked at this above/below the solar equatorial plane a few times with some neat software made available by semi, so far nothing has surfaced as a possible driver of hemispherical power.

The occurrence of single hemisphere dominance is recorded during the Maunder Minimum, there is a real chance for the first time we may witness empirically a non reversing solar pole during SC24. The current pole strength graphs are showing the north heading slowly towards pole reversal while the south remains flat.


Dynamic Density of Hemispheres

If only I had the skills in Blender, I'd plug the masses in and run the simulation myself. If I could watch the sun do it's dance around that point, I'd probably get a clue as to the causal mechanism. With all that mass I know relativity must complicate matters, but the sun is still essentially obedient to fluid dynamics. The density of hemispheres must change over time, and that's going to change conductivity... probably a lot of things.

Conveyor Belt

You might have hit the nail on the head, Hathaway studies the two conveyor belts that transport magnetic flux from the equator to the poles and back again. The lower part of the belt increases in density as it slows, the top of the belt decreases in density and increases in speed at the same time. Around 2005 Hathaway recorded the belts at the lowest level on record (lower belt), but the most interesting aspect is that the southern belt was moving at about half the pace of the north.

Around 2005 the Sun entered into its disordered orbit of the SSB which also coincides with the reasonably strong angular momentum perturbation (AMP) that comes along in groups every 172 years, is this a coincidence?

On another issue recently noticed, during past grand minimum type cycles this AMP event has to occur during the downslope of the previous cycle to have its effect on the next. SC4 and SC23 follow this rule nicely but the AMP events of 1830 and 1965 had a different timing and occurred on the up ramp of the cycle. This might be related to "Wilson's Law". Timing is important.


Solar Mass Relative to Invariable Plane

So far the only "pre-made" modelers I've been able to find are either strictly 2-dimensional (Celestia - open source) or clunky 3-dimensional (Solar System Live).
 
With Solar System Live plugging in 0 degrees under the "Heliocentric" fields and changing "Size" to 1024 gives a nice side view of the solar system. So all I get is something to eyeball, but it's better than nothing. Currently Saturn is clearly north of the invariable plane, Neptune looks a smidge north of it, while Jupiter and Uranus are too close for me to tell. But I'm thinking that the combined mass of Saturn and Neptune north of the plane, with Jupiter and Uranus essentially at the plane, are going to put Sol south of it, thus south of the solar system's barycenter.
 
So with the mass of the sun being pulled north, the more fluid outer layers (chromosphere, etc.) should be pulled towards the dense core in the southern hemisphere, and away from the dense core in the northern hemisphere. Making Sol's southern hemisphere denser than the northern hemisphere.
 
That's as good an analysis I'm able to do with my skill set. Celestia looks like great open source software, but it's too bad it doesn't show Sol's position bobbing north/south of the barycenter. Even the 2D animations are helpful - you might consider linking to some of Celestia's animations from your site. The visual models do a lot for laymen like myself. You could even download Celestia (free) and create your own animations for the site.
 
Celestia animation demonstrating the concept of the solary system barycenter, and Sol's relationship to it (awesome!): Solar System Barycenter Explained
 
Unrelated to your research, but still an interesting Celestia animation: Speed of Light Demonstration
 
The first video in the links helped me understand a lot, especially as I watched it side-by-side with the "Rosetta Stone" graph of Sol's angular momentum. The zero points of angular momentum correspond to Sol's core passing through the barycenter. The high peaks correspond to Sol reaching a maximum distance in travelling away from the barycenter, then turning back around for an approach. At those irregular jogs with the green arrows - Sol temporarily enters a near circular orbit around the barycenter (in the XY axis, that is), before whipping back around with high eccentricity. This is all probably intuitive for people who understand what angular momentum is, but I had to take college physics twice just to get a B.

Fuzzy Thinking about Magnetic Fields

'You might have hit the nail on the head, Hathaway studies the two conveyor belts that transport magnetic flux from the equator to the poles and back again. The lower part of the belt increases in density as it slows, the top of the belt decreases in density and increases in speed at the same time. Around 2005 Hathaway recorded the belts at the lowest level on record (lower belt), but the most interesting aspect is that the southern belt was moving at about half the pace of the north.;

As an Electral Engineer, I object strongly to these fictions about magnetic flux. Magnetic fields are the RESULT of electrical current flow. They DO NOT exist by themselves.

WSO solar graph has been

WSO solar graph has been updated. There is still a reluctance for a polarity change, but the southern hemisphere has made a recovery for now. With solar max about 2 years away the question remains "will there be enough sunspot activity necessary for pole polarity reversal"?

Here is a graph from

Here is a graph from wattsupwiththat.com - http://wattsupwiththat.files.wordpress.com/2010/12/dalton_fig1.png

My question is this: the solar polar magnetic field strength is highest during minima of/between stronger solar cycles? Would this be because the huge amount of magnetic energy during such cycles accumulating towards the poles, which causes the polar flip, would then be released into the dipolar magnetic field?


The poles can be stronger at

The poles can be stronger at cycle minimum because there is less left over sunspot canceling flux heading in that direction. As the cycle builds the opposing flux which is left over from the sunspot polarity region that is closest to the pole (spots are always tilted), builds towards the poles before they cancel out near cycle max then build again with an opposite polarity. There are many theories around but I think the dynamo drives the cycle (controlled by outside forces) and the poles are a product of the process.

I agree. The planets may have

I agree. The planets may have a spin-orbit coupling effect on the Sun which affects its rotation rate, which would then affect the solar dynamo and sunspot production, and therefore the build up of magnetic flux at the poles, and the length of a solar cycle: if the solar cycle is weaker with less sunspots, it'll take longer for the build up of opposing flux to reach the point when it flips the poles. Is that right, or am I oversimplifying it? Also were my suppositions in my previous comment correct? Thanks

The various dynamo theories

The various dynamo theories suggest the conveyor belt transports the flux down to the tachocline where it is recharged and then surfaces as sunspots. So stronger pole activity would be further enhanced. I think the magnetic flux is driven from the interaction of the two shear layers at the tachocline and rises 2 years later. What controls the 11 year length is a mystery to all sciences.

Many thanks go to Carl's brother Dave for providing the Domain, Server and Software.