|
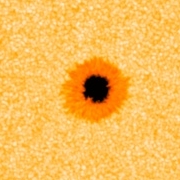
| Moving Magnetic Features (MMF) being ejected from Sunspot 1101 at around 6000 kph. Some building new zones and others canceling out opposite magnetic flux. Notice the spiral effect along with the creation and destruction of negative zones. |
For those following the current cycle, most would notice the slow ramp up of activity compared with the last 30 years. Solar cycle 24 (SC24) could be one of the slowest ramp ups in 200 years, but there are other factors not following the normal pattern. The F10.7 Flux readings are staying flat and behaving in an unusual manner, plus the EUV values have remained low. Most who read this blog know of my predictions for the coming two cycles which translate to a solar grand minimum.
But something else has emerged over the last month that could have a large impact on SC24. There is a new wave of Alpha/Unipolar sunspots that behave quite differently from the norm. I will call them Negative Sunspots. It is difficult to obtain statistics on large Unipolar groups, past studies have reported all types of Unipolar groups make up around 38% of the overall activity between 1915-1953, but this will include many small single pores. It might become a future project if the current trend continues.
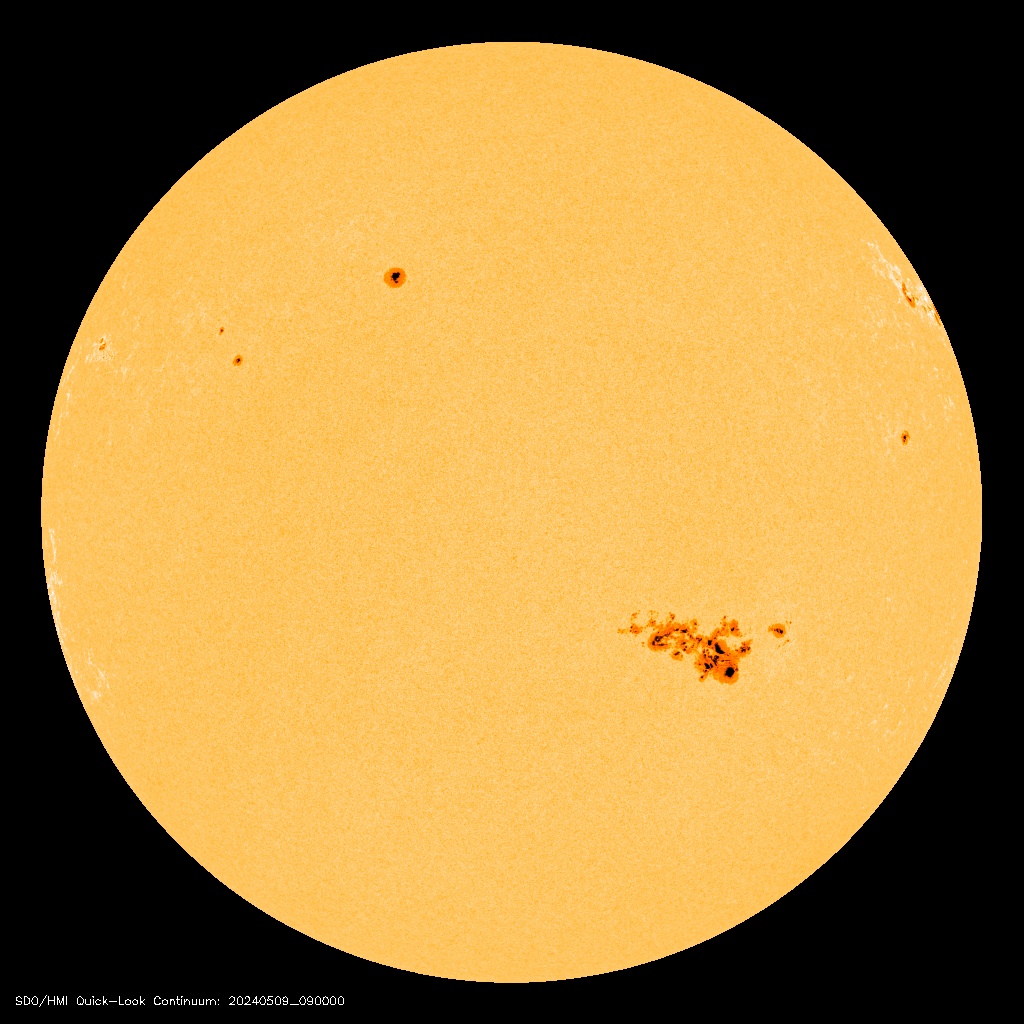
During July & August we witnessed 4 single spots: 1084, 1092, 1093 and 1101.


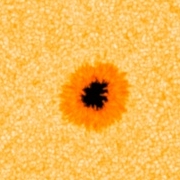
These dark single spot (alpha) regions are very different to the regions we saw in the first three months of this year when activity was high. Three of the Negative Sunspots began life in a normal magnetic state with their polarity showing the normal pattern. But as they progressed across the face the polarity slowly reversed, ultimately evolving into fully reversed polarity regions.
Another feature of these unusual Negative Sunspots is the associated F10.7 Flux and Extreme Ultraviolet (EUV) readings. These spots show little, if any, flare activity and what looks to be occurring is a reduction in F10.7 and EUV output when the Negative Spots dominate. This will have climate implications if sustained.
The solar magnetic cycle that flips polarity at the poles approximately every 11 years is dependent on the reversing flux from spent sunspots that migrate to the poles. During this cycle we are already seeing low sunspot activity as well as an increase in the speck ratio. Now we are seeing Negative Sunspots that will continue to erode the power of solar cycle 24. I think this will show a cycle that is out of magnetic balance, and will require another subsequent cycle before we get back on track to normal solar activity.
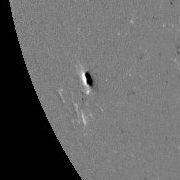


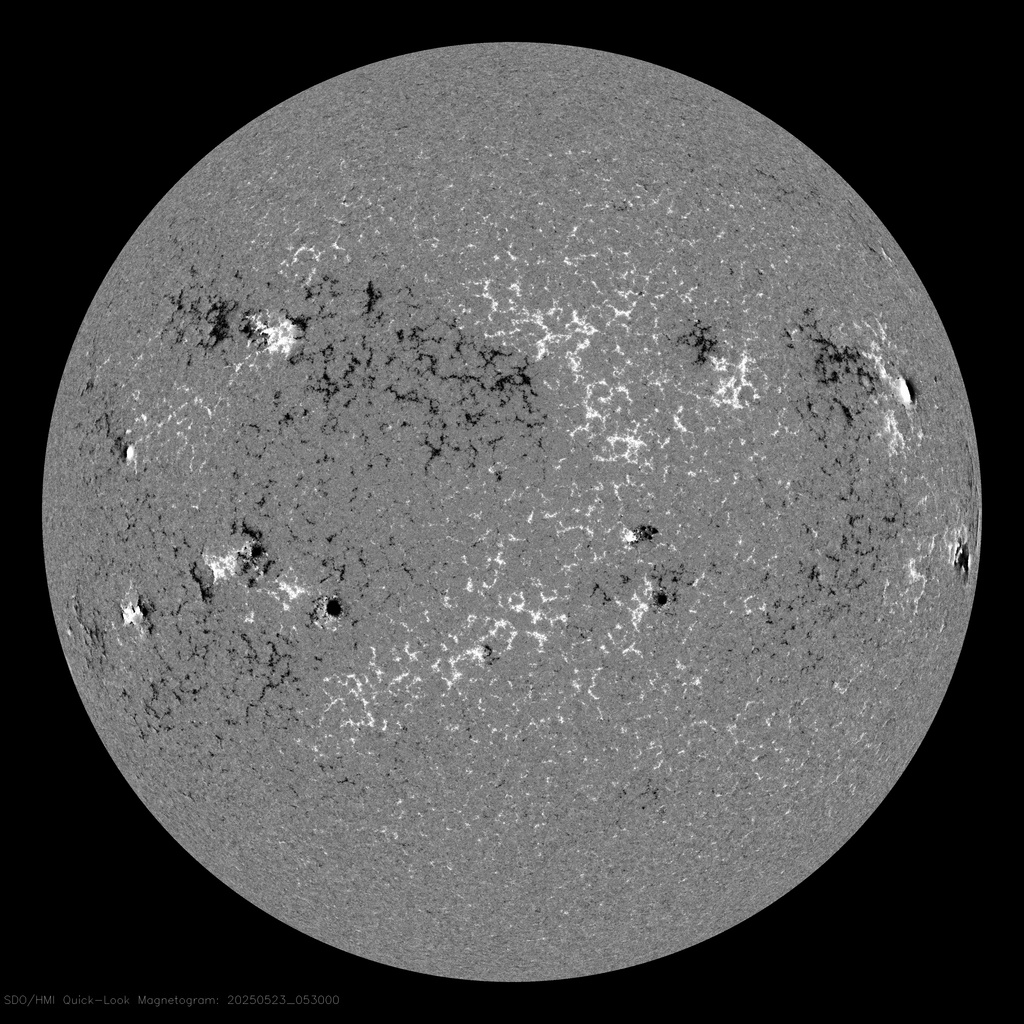
All four Negative sunspots have followed the same pattern (1101 still in the progress) on the magnetogram. All four spots started with the black area leading the white, by the meridian the black area completely dominates the white area covering it completely. As the spots move off the face the polarity is reversed with the white area leading, but here's the kicker. One of these spots is in the southern hemisphere. So the northern hemisphere spots started in their correct configuration and changed polarity to finish reversed. 1084 in the south began life in reversed polarity (the dominate area should be white?) only to correct itself as it was leaving. Some of this may be due to an optical effect according to Dr.Svalgaard (I am not convinced, see below) but more important is the output from these weak alpha spots.
Will these outbreaks of weak Alpha spots be a rare event or something we may get used to during SC24?
 The other notable anomaly is the F10.7 Flux levels during these events. Normally the Flux levels are a good general indicator of solar activity, but it has been observed that the F10.7 Flux levels have actually decreased while the Negative Sunspots have appeared and grown. 1084 appeared after a short spotless run; the adjusted high flux reading prior to rotating onto the face was 77.2 after two days it had dropped to 75.5. The reading fluctuated around 75 before dropping further to 74.6 before rotating off the face. The next day was spotless but the flux reading jumped up to 78.3, there was a new plage region that day which proved stronger than the Negative Spot. The following day a weak normal region (1087 with associated plage) moved onto the face pushing the flux reading up to 84.7; the net affect of 1084 was negative. Several weeks later 1092 and 1093 were on the face at the same time along with some large groups and plage areas making it hard to see the influence of the Negative Spots, but the current 1101 region is a different story. 1101 rotated onto the face after an 8 day spotless run (not counting minor specks); the starting point was a high of 76.3. Over the next seven days the reading gradually declined to 73.3, all while 1101 grows larger and darker. On the eighth day a new very small normal region (1102) appeared which immediately sent the reading to 75.4. Something is surely not right here? The F10.7 values are recorded for the day before in each case, but this takes nothing away from the decline observed.
Now for th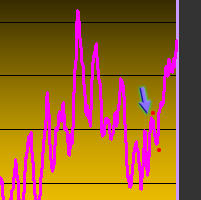 e big news. I can only compare the EUV readings at this stage for 1084, but the EUV reading followed the trend of F10.7 Flux. The reading just before 1084 on the 25 June was 1.11E+10, over the next week it dropped to 1.07E+10 then immediately rose to 1.13E+10 when 1084 left the face. For the first time this cycle we have observed sunspot activity that possibly reduces the F10.7 Flux and EUV. Currently EUV is being investigated as a driver in our climate system. This discovery could help explain the link between grand minima and a cooling planet.
The tight relationship between F10.7 and EUV remains, but the perceived bond between the sunspot record and F10.7 can no longer be relied on. I must stress these are preliminary results and this trend will need to be sustained to have any impact, the negative trends could be a result of background fluctuations in faculae or plage. At best the current crop of Alpha spots contribute nothing in the way of F10.7 Flux or EUV which in itself gives a negative result when comparing with the sunspot number. This area certainly is worth watching.
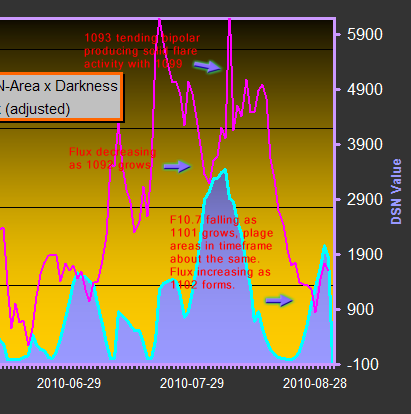
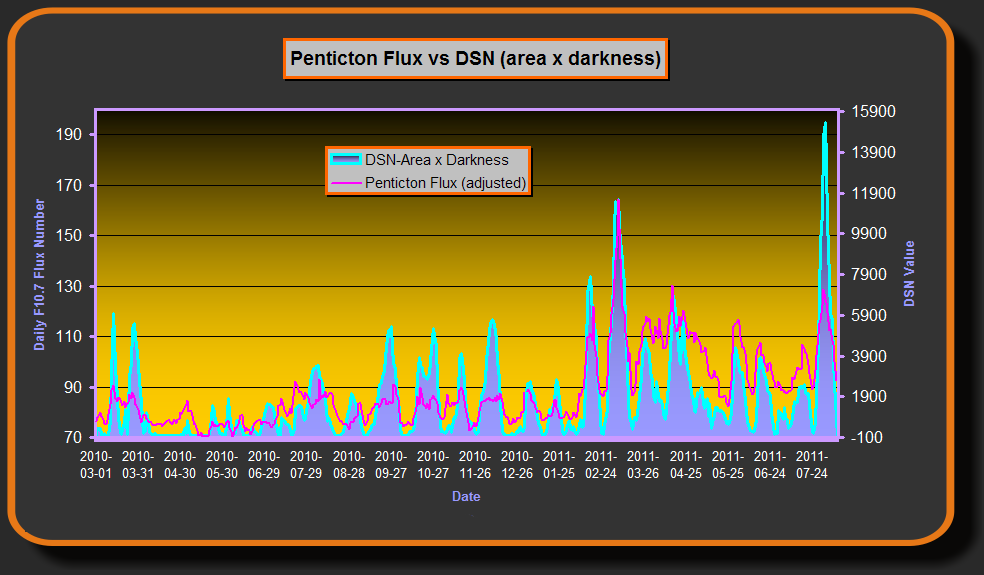
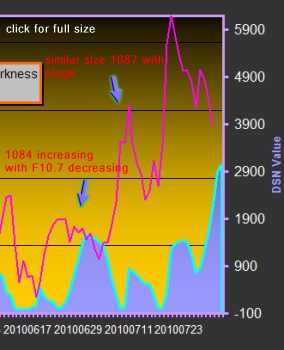
New F10.7 Flux update versus DSN value (area x magnetic strength) showing the Flux value dropping as 1101 continues to form. The background faculae/plage areas on the magnetogram appearing about the same over the decline period. Some further investigation on 1092 suggests it may be possible to isolate a trend from the background noise. This area formed after a big influx from 1089. On the down slide which still had a large magnetic area from 1089, 1092 formed and put up no resistance allowing the Flux to dive, perhaps accelerating the down slide towards the bottom before the initial bipolar spot 1093 appeared. 1093 was classified bipolar on entry which then morphed back to a unipolar structure briefly, 1093 then showed retrospective tendencies splitting in two producing an M class flare and C class flares joining with region 1099. On balance 1093 cannot be considered a negative sunspot. There are a few factors to consider but there is a real chance the weak Alpha type spots may actually diminish the F10.7 Flux & EUV values, this is a difficult area to be precise with and will require future data to establish a clear trend.
The EUV values are usually available around 2 weeks after the actual date. Check back for an update on 1101.
I think one area we can be precise with is: If the ratio of weak Alpha spots continues as presently seen SC24 will continue to weaken further, along with the Flux values moving sharply away from the sunspot values. The associated weaker levels of EUV will impact on the Thermosphere and ozone production.
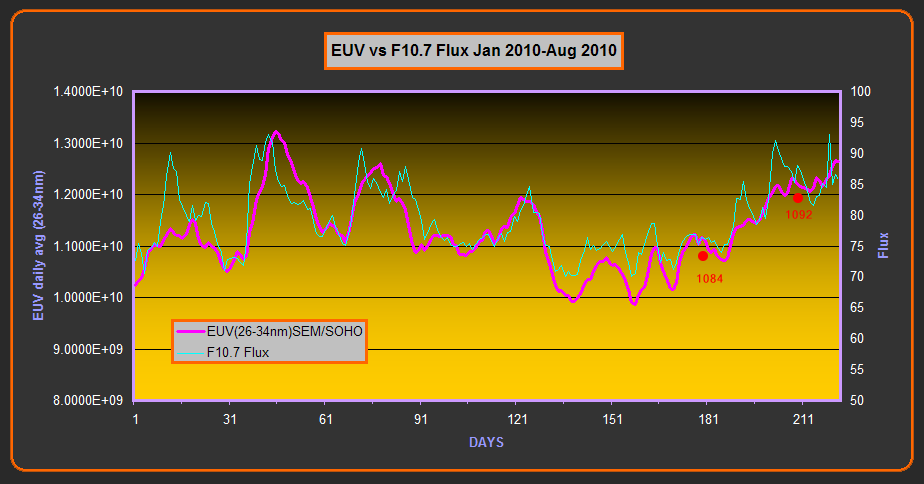
The above graph showing the relationship between EUV and F10.7 Flux. Notable times of divergence demonstrating the relationship can be loose. The base levels in particular at 151 days showing the greater modulation in EUV. How much higher would the overall values of F10.7 & EUV be without the presence of Negative Spots?
RESEARCH AND DISCUSSION
There is a lot of research available on unipolar sunspots, This paper discusses the magnetic flux cancellation in relation to unipolar spots. Part of the function is via moving magnetic features (MMF) that propagate from the central region out across the penumbra and onto the surrounding moat area where they are nullified by the opposite polarity regions. Another source of information regarding this phenomena HERE.
The MMF are small magnetic elements that move away from sunspots (unipolar only) and collide with the opposite polarity field and result in magnetic flux cancellation. Thanks to the new SDO satellite we are able to see this process in action via a magnetogram animation they provide daily. The amazing detail clearly shows the magnetic elements migrating from the black central area to the white region nearby ( you need to concentrate on the edges and watch for small black specks radiating out). The white zones have to exist for this to happen and cannot be an illusion? During the early stages of 1101 the majority of migration moves from right to left towards the white zone and later the opposite occurs. Being unipolar perhaps with the exception of 1084 the polarity is not an issue, what is being observed is an attraction of negative (white) zones of the left side of the region in the early stages which then reverses later as the right side takes over. When 1101 is on the meridian there is a large negative zone to its right which does not follow Dr. Svalgaard's theory along with new trailing negative zones on the left that are consumed but the larger negative zone prevails on the right side as the spot heads off the face. Whether this function has any impact on F10.7 Flux production is unclear to me, but one would assume if magnetic flux is being vacuumed off the face there would be a reduction in F10.7 Flux. The animation is enlightening.
The new animation at the top of the page is one I built from cropped 4096 x 4096 images taken on the 31st Aug. The extra detail showing both negative and positive magnetic material being ejected from the flux tubes. Its possible the negative white regions that are seen each side of the main black region are being formed from within the spot. Notice also the spot is spiraling which could explain why the negative area appears on the left side then moves to the right side. From a rough scaling I estimate the speed of the ejected MMF to be around 6000 kph.
Links to SDO animations:
Early 1101 (warning 16Mb)
Late 1101 (warning 16Mb)
UPDATE 25th Oct 2010:
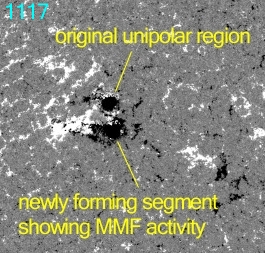 The Unipolar regions continue to dominate. Since the original story was published we have seen another 5 Unipolar groups (1106, 1108, 1113, 1115, 1117) and at present there are 3 Negative Sunspots on the face with the F10.7 flux values hovering around the low 80's. Region 1117 has produced another negative sunspot that now technically classifies the region as bipolar but as can be seen on the SDO we see the familiar magnetic structure that emits MMF with its flux eating capabilities.
Since the start of July 2010 we have had 18 sunspot regions as counted via the Layman's Count. During the same period we have seen 9 large unipolar groups.
If this is sustained the Flux and EUV levels will begin to trend away from the Sunspot number, and we will also witness a reduced Ionosphere which should influence the polar atmospheric pressure oscillations. This will further impact the shape and incursion of the polar jet streams. The current La Nina will continue to strengthen and could develop into the deepest on record if the current trends continue, the earlier prediction of a massive winter for the northern hemisphere is right on track.
UPDATE 8th Feb 2011:
Large unipolar groups are still dominating. Will this trend continue. I have plotted every region recorded by the Layman's Sunspot Count from Jan 2010 along with the frequency of large unipolar groups. There is clearly a change after sunspot 1084 in July 2010. Click graph for a full size view.