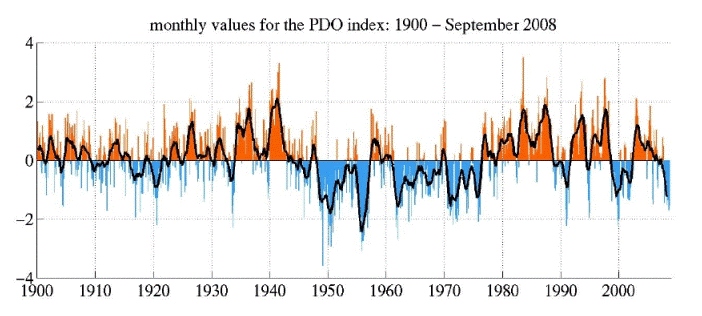
The Pacific Decadal Oscillation (PDO) is a long time record going back to 1900 that measures the spatial temperature changes in the Pacific ocean. There is a 30 year trend of cool periods followed by warm periods that are very closely associated with the ENSO record (El Nino/La Nina). Below is a diagram of the temperature changes that occur in the Pacific and what constitutes a warm or cool phase.

The obvious difference between the phases is the cold/warm pool that forms in the Pacific North West adjacent to Japan. When the pool is warm the central Pacific is cool and in La Nina mode. When the same pool is cool the equatorial regions are warm and experiencing El Nino conditions. The important point is that a cool PDO encourages deeper and more prevalent La Nina's that can last 30 years. Also notice the cool or negative phase has a warm pool in the Pacific North West, it's called the cool phase for a reason. The PDO values are calculated using the Sea Surface Temperatures (SST) from the North Pacific above 20degN, but the overall status of the PDO is determined by whats happening at the equator. Cool phase means cool equator with a warm pool in the Pacific North West.
The AGW crowd tell us that solar modulation as well as ocean cycles such as the PDO have no effect on climate. A visit to a AGW friendly site such as SkepticalScience will display arguments trying to destroy natural variation climate processes such as the PDO. The most common mantra is that the PDO lags ENSO and cannot have an effect on world climate. One of the papers rolled out from Newman et al (2003) tries to convince us that ENSO is the absolute controller of the PDO.
This of course could be true, but if so we are still left with the conundrum of what influences the cool/warm phases of ENSO? Looking at the record we see from 1910-1945 a period where the warmer El Nino's reined which was associated with a warming planet. After 1945 the PDO ( ENSO) turned cool which saw a dominance of La Nina and the world temps took a dive up until 1975. From 1975 to around 2000 the warm PDO saw a big dominance of El Nino conditions that coincided with a reasonable rise in world temps. We are now in the cool phase again and witnessing some fairly major La Nina action that has had major climate effect across our planet over the past 3 years. There is also a solar component which I will touch on later.
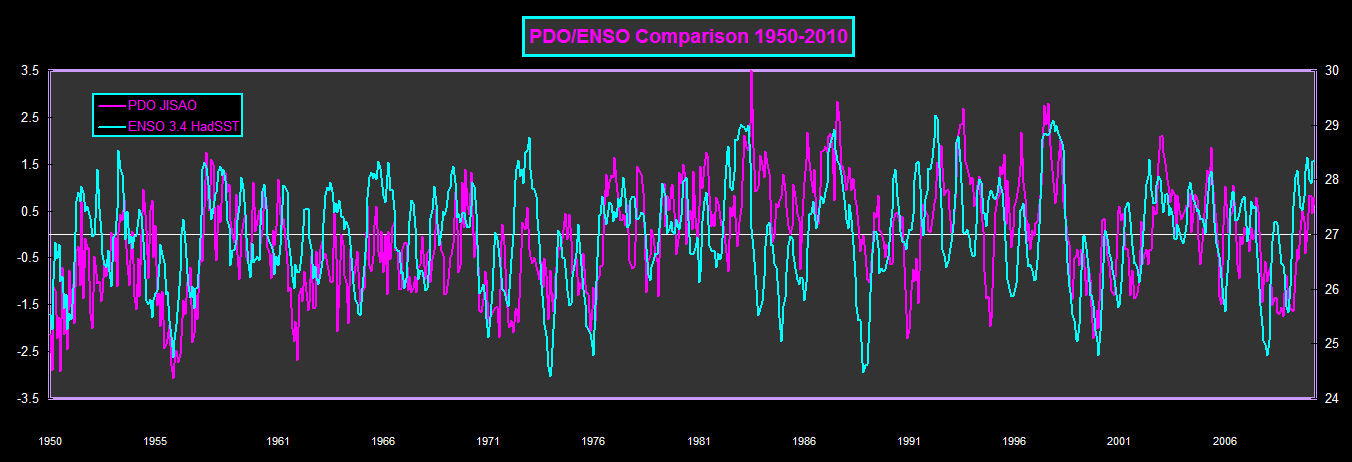
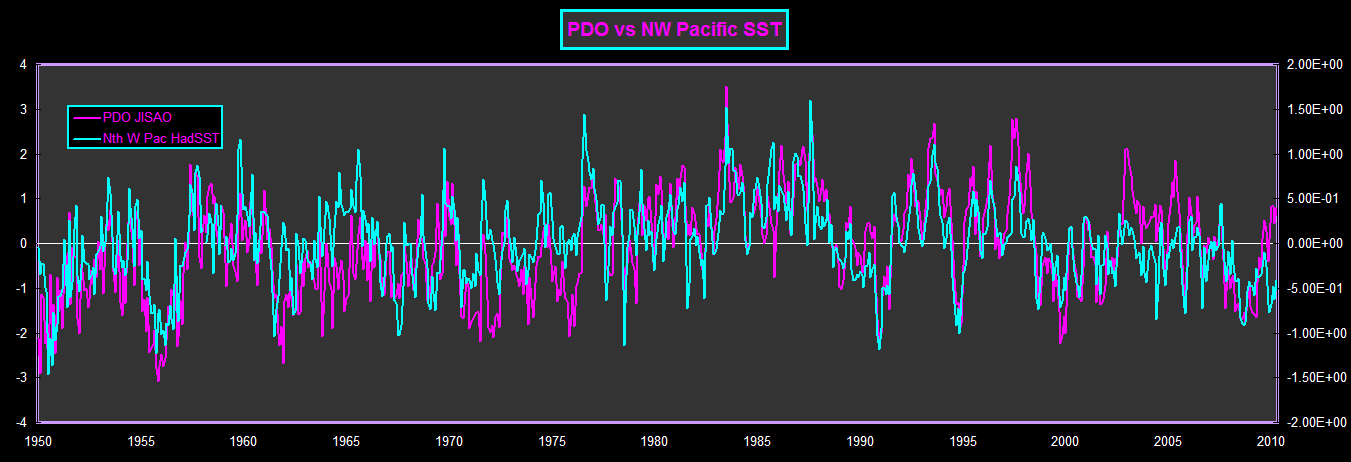
One of the problems when trying to research the PDO/ENSO relationship is what data set do you use for analysis? There are multiple PDO reconstructions along with multiple ENSO records that can produce different results which opens a minefield when trying to achieve a reasonable analytical outcome. I will start by comparing the most widely accepted PDO data from JISAO. The initial ENSO data will be from HadSST that is considered to be raw data. (I would not be so sure). Below is a graph comparing the two series that starts from 1950 which is considered the starting point for accurate records.
Click on graphs for a full size view.
Very obvious is that there is a general agreement between the 2 datasets. But is there a trend where the ENSO follows the PDO or vice versa? When looking at these 2 particular data sets I would say there is no relationship in one being a driver to the other. Clearly there are times when each leads the other, so when using these datasets the science is far from settled.
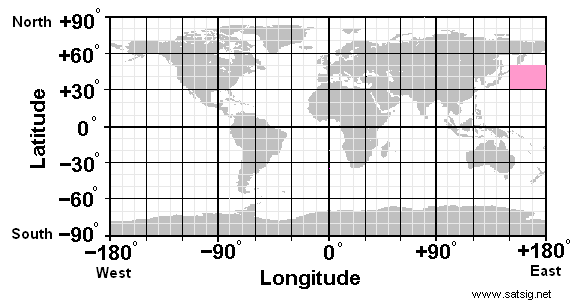
But let's look a little deeper into how the PDO values are calculated. The basic data is retrieved from the Pacific SST's from above 20degN. A convoluted algorithm is applied to recognize the spatial pattern changes across the Nth Pacific which is then adjusted by removing world SST trends to remove any "global warming signal". But in reality the PDO finished values are very close to the inverted SST values recorded from the pool in the North West Pacific. I have sampled the SST records from 30-50degN and 150-180degE using the HadSST data as shown in the following diagram.
Remember the NW pacific pool is used as an indicator of the rest of the Pacific basin when creating the PDO record. Below we can see that the inverted NW Pacific SST records very closely resemble the finished PDO values.
So the PDO record is a very good indicator of the ENSO modulation/frequency position since 1900. There is a scaling factor between the 2 datasets that is obvious when dealing with 2 different recording methods that takes nothing away from either record. Basically the trends match.
If looking at the PDO record in isolation the actual modulating trend is fairly flat but we must remember the "global SST factor" has been subtracted. My thoughts are that oceanic trends are one player in the global climate game, solar influences are the remaining factor. Elsewhere on this blog there are articles dealing with the solar influence on climate, the 2010/2011 Northern Hemisphere winter was as predicted a massive event which was a combination of the ESNO state mixed with the massive changes in the jet stream that funneled cold air from the Arctic. The jet stream changes in both hemispheres are solar induced and will remain with us for 30 years, coupled with ENSO and atmospheric teleconnections the world climate will be modulated in a downward trend of around 1 deg C for the next 3 decades.
The obvious question arises, what drives the PDO/ENSO factors that help to govern the global climate. Science has no solid answer to date but there are a few leads that might develop into something substantial. Check out the Scafetta and Wilson research HERE.
Of interest is another ENSO dataset from JISAO that is calculated in a different fashion. It looks at the whole equatorial region as well as factoring in the associated pacific SST's north and south. This kind of ENSO reconstruction is considered a low frequency version of the ENSO record that in some cases is more favorable when looking to the PDO as a driver of the ENSO record. Another version has been constructed by Bunge & Clarke that is supposed to show a PDO influence. Below is a comparison of the JISAO ENSO record and the HadSST record.

Footnote: La Nina conditions initiate from strong easterly trade winds that "tilt" the pacific thermocline through atmospheric pressure that starts the upwelling of cold water on the South American coast. The Walker circulation is the pump that begins the easterly trade winds which can only start when there is warm water off the Asian coastline. The warm water in the NW Pacific is around at the same time, understanding what drives the warm pool will be the answer to the puzzle.
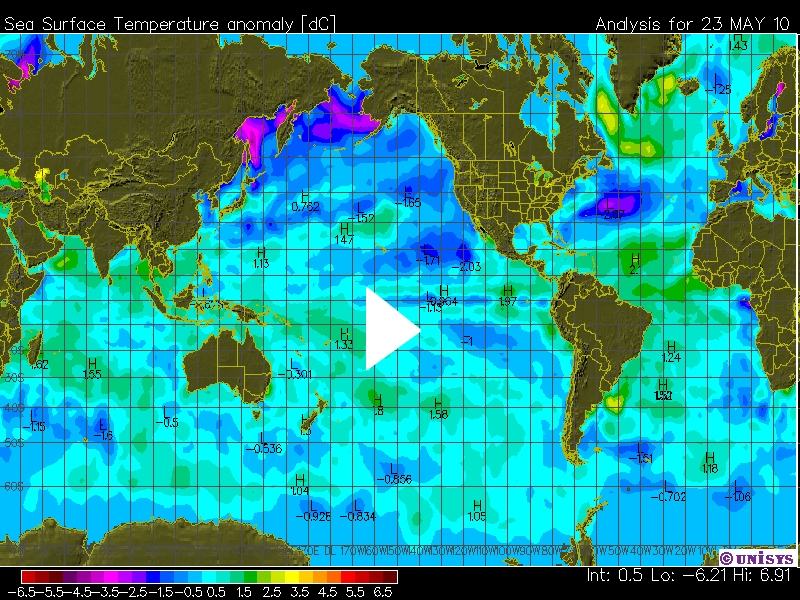
One last question to ponder: If ENSO drives the PDO how do we have multiple La nina's/El Nino's in succession? My thoughts are that the warm pool has to exist on the western equator near Asia before a La Nina can start, sometimes that same water is either late or early in the North West Pacific, but in most cases is there. Here is a video (33Mb) from May last year showing the progression, the conditions in the west happening very quickly in late May 2010 building the La Nina (in this case the NW pacific receiving the warm water late).
Another way at looking at it is to consider that the La Nina state is the natural position of the Pacific. El Nino is a disturbance that interrupts the natural system which is triggered by the westerlies that occur over the warm pool in the west. This interaction moves the Walker pump further east which weakens the trade winds, and stops the upwelling of  cold water off the South American coast which allows it to warm in the East with some sloshing back of what warm water is left in the West. The SOI index has tracked this trigger since the late 1800's and basically measures the sea level pressure difference between Darwin and Tahiti. When Tahiti sea level pressure is lower than Darwin the trigger for El Nino is present, the state of the warm pool also being a factor. The SOI index is also very close to the PDO when comparing the 30 year trends, long term pressure differentials in the Pacific effectively could be a large part of the PDO cycle.
The PDO is the indicator/instigator of the ENSO predominant state over decadal time frames. The Pacific equator being the major variable in determining overall trends in global SST's. PDO/ENSO either warms or cools depending on the balance of the cold water upwelling allowed in the eastern Pacific measured against the amount of solar warming. This balance is then redistributed to the remaining oceans with the Atlantic receiving last (explains why the AMO lags PDO). The upward step changes in world SST since 1981 is expected with a positive PDO along with solar activity being at the top of a wave not seen since the MWP. The solar influence being chemical with a hint of radiative. Negative PDO periods should show a step in the reverse direction, especially when coupled with decreasing solar. This all ties in very nicely with the solar powerwave concept.