question

What modulates our Sun? The majority of science work on the principle that the Sun is self modulating and each solar cycle is a product of a random number generator. There are others that suspect the Sun is modulated by the planets with a special emphasis on Uranus & Neptune. Thanks to Carl Smith who has recently left us we have new knowledge that significantly adds to Jose, Landscheidt & Charvàtovà's work.

Geoff Sharp

A Guide to Understanding the Solar Powerwave.

Fig.1. Click on the graphs for a full size view. Only one strong Disruptive Force this cycle ensuring a weak Dalton type event.

Understanding the Powerwave action that controls solar output in respect to Angular Momentum Theory (AMT) is a  fundamental requirement that perhaps very few have a basic insight. This article will attempt to explain the theory in segments which will hopefully spread some insight into this fascinating real world observation.

AMT begins with the orbital path of the Sun. The Sun does not remain stationary in the centre of the solar system, but instead orbits a point or gravitational centre of the solar system (SSB). The gravity of the outer 4 planets determines the daily position of the Sun which follows a kaleidoscope pattern orbit around the SSB. The orbit shape is basically an inner loop followed by and outer loop and is primarily controlled by Jupiter and Saturn.

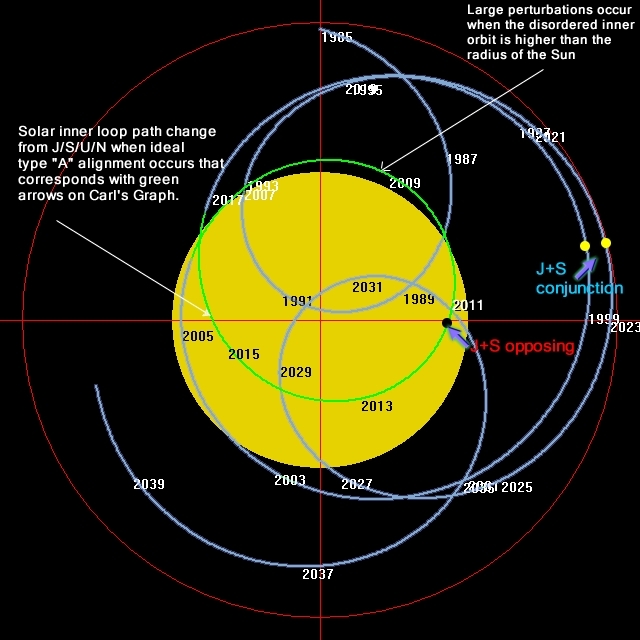
Fig. 2 The green/purple line denotes the centre of the Sun on its path around the SSB (red crosshairs)

At its greatest point the Sun can have its centre 1.6 million kilometers from the SSB and also experiences a 100% velocity change compared to the inner loop that generally returns to the SSB, the two loops each follow a rough 10 year timeline which DO NOT line up with solar cycles. Solar Angular Momentum is calculated from these movements and can be seen in Carl's famous graph.

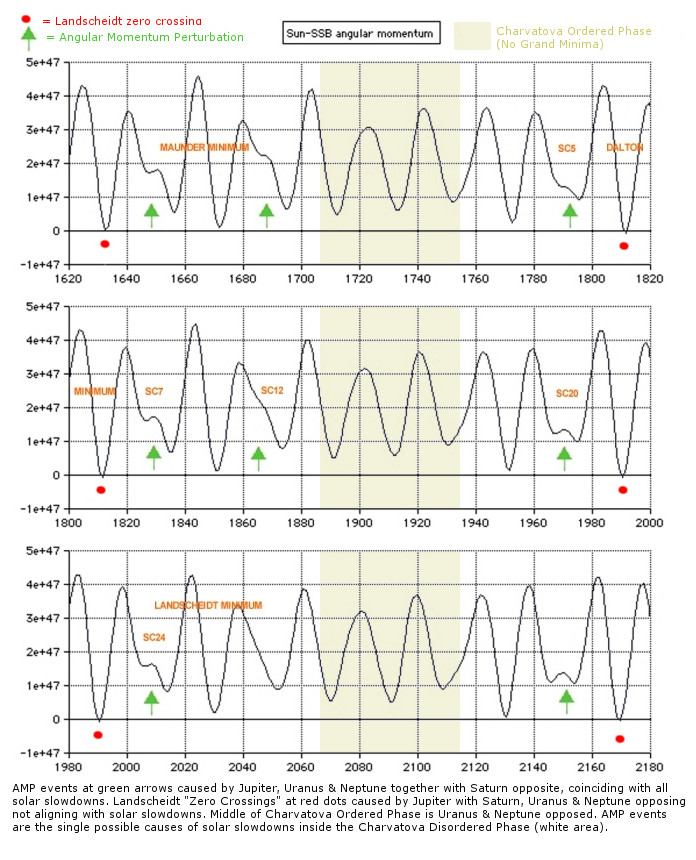
Fig. 3. Carl's Graph derived from JPL data.

AMT has two cornerstone forces.

1. The Modulating Force.

2. The Disruptive Force

Fig.1 shows a pink powerwave that modulates the height of solar cycles and is the Modulating Force. This wave follows the general trend of solar activity which correlates with the solar Angular Momentum (AM) wave, the top of the wave is always at the conjunction of Uranus & Neptune. This wave has been described many times in science and is sometimes called the Gleissberg cycle, the AM wave is powered by Jupiter and Saturn but is modulated by Uranus and Neptune as they return to conjunction every 172 years (this function also recently observed by Scafetta). While observing the modulating wave it is important to understand the integration of the Disruptive Force which can easily knock out the high solar cycles at the peak of the wave.

The Disruptive Force is the only variable in solar output (other than the smaller Modulating Force) and ultimately is what controls the shape of the Holocene solar record. The Disruptive Force comes from two particular planetary positions that occurs in groups near the top of the AM modulating wave. The Main Disrupting Force is experienced when the outer 4 planets are in the position shown in Fig 4.

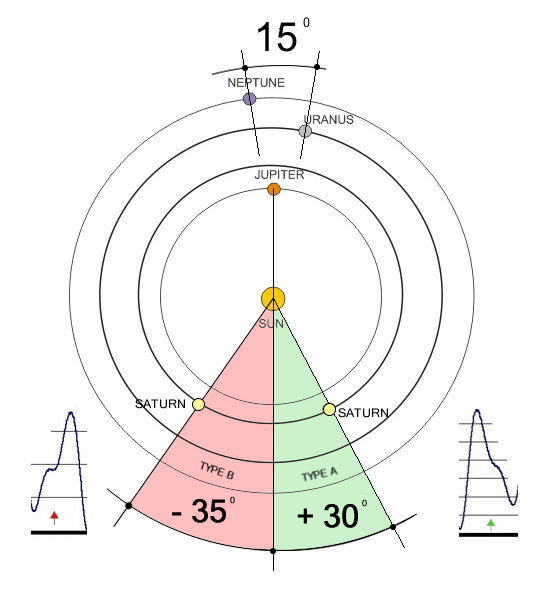
Fig. 4. Type "A" at 30 deg. being amongst the strongest perturbations and grand minima of the Holocene.

Uranus and Neptune when near conjunction alter the normal pattern of Angular Momentum because of their combined gravity as seen at the green arrows on Fig.3. At the same time the normal path of the Sun is altered as seen by the purple curve on Fig.2. Charvàtovà and others have noticed that solar grand minima occur during times of the altered path of the Sun but now we can understand how to quantify the solar downturn that occurs during the altered path. The altered path of solar cycle 20 is not that different to the current cycle but the results should be very different. There is also another altered path (Type "B") that is generally weaker but just as important and not observed by Charvàtovà. The Disruptive Force or Angular Momentum Perturbations (AMP) occur in groups separated by roughly 40 years either side of the height of the Uranus/Neptune modulating wave. Most common is three groups per 172 year cycle (avg) but can be as few as two and as many as five. By understanding the strength of each disrupting or AMP event we can determine the amount of solar downturn for the era, this is done by observing the perturbation shape on Fig. 3 at the green arrows and by also observing the 4 outer planet angles in relation to each other as seen in Fig.4. and Fig. 5.

Some may ask why does the Disruptive Force have so many different strengths and occurrences during the height of each 172 year wave. Jose back in 1965 made the mistake of declaring the outer 4 planets return to the same position every 178.8 years. This simply does not happen and can easily be verified by using any online solar system viewer and going back in steps of 179 years. The orbital mechanics of the outer 4 planets move very slowly over thousands of years whereby the positions evolve and never return to the same position (but come close every 4630 years or 27 x 172 yr cycles). This evolution of the outer 4 planet positions is what shapes the Holocene solar record seen in Fig 5.
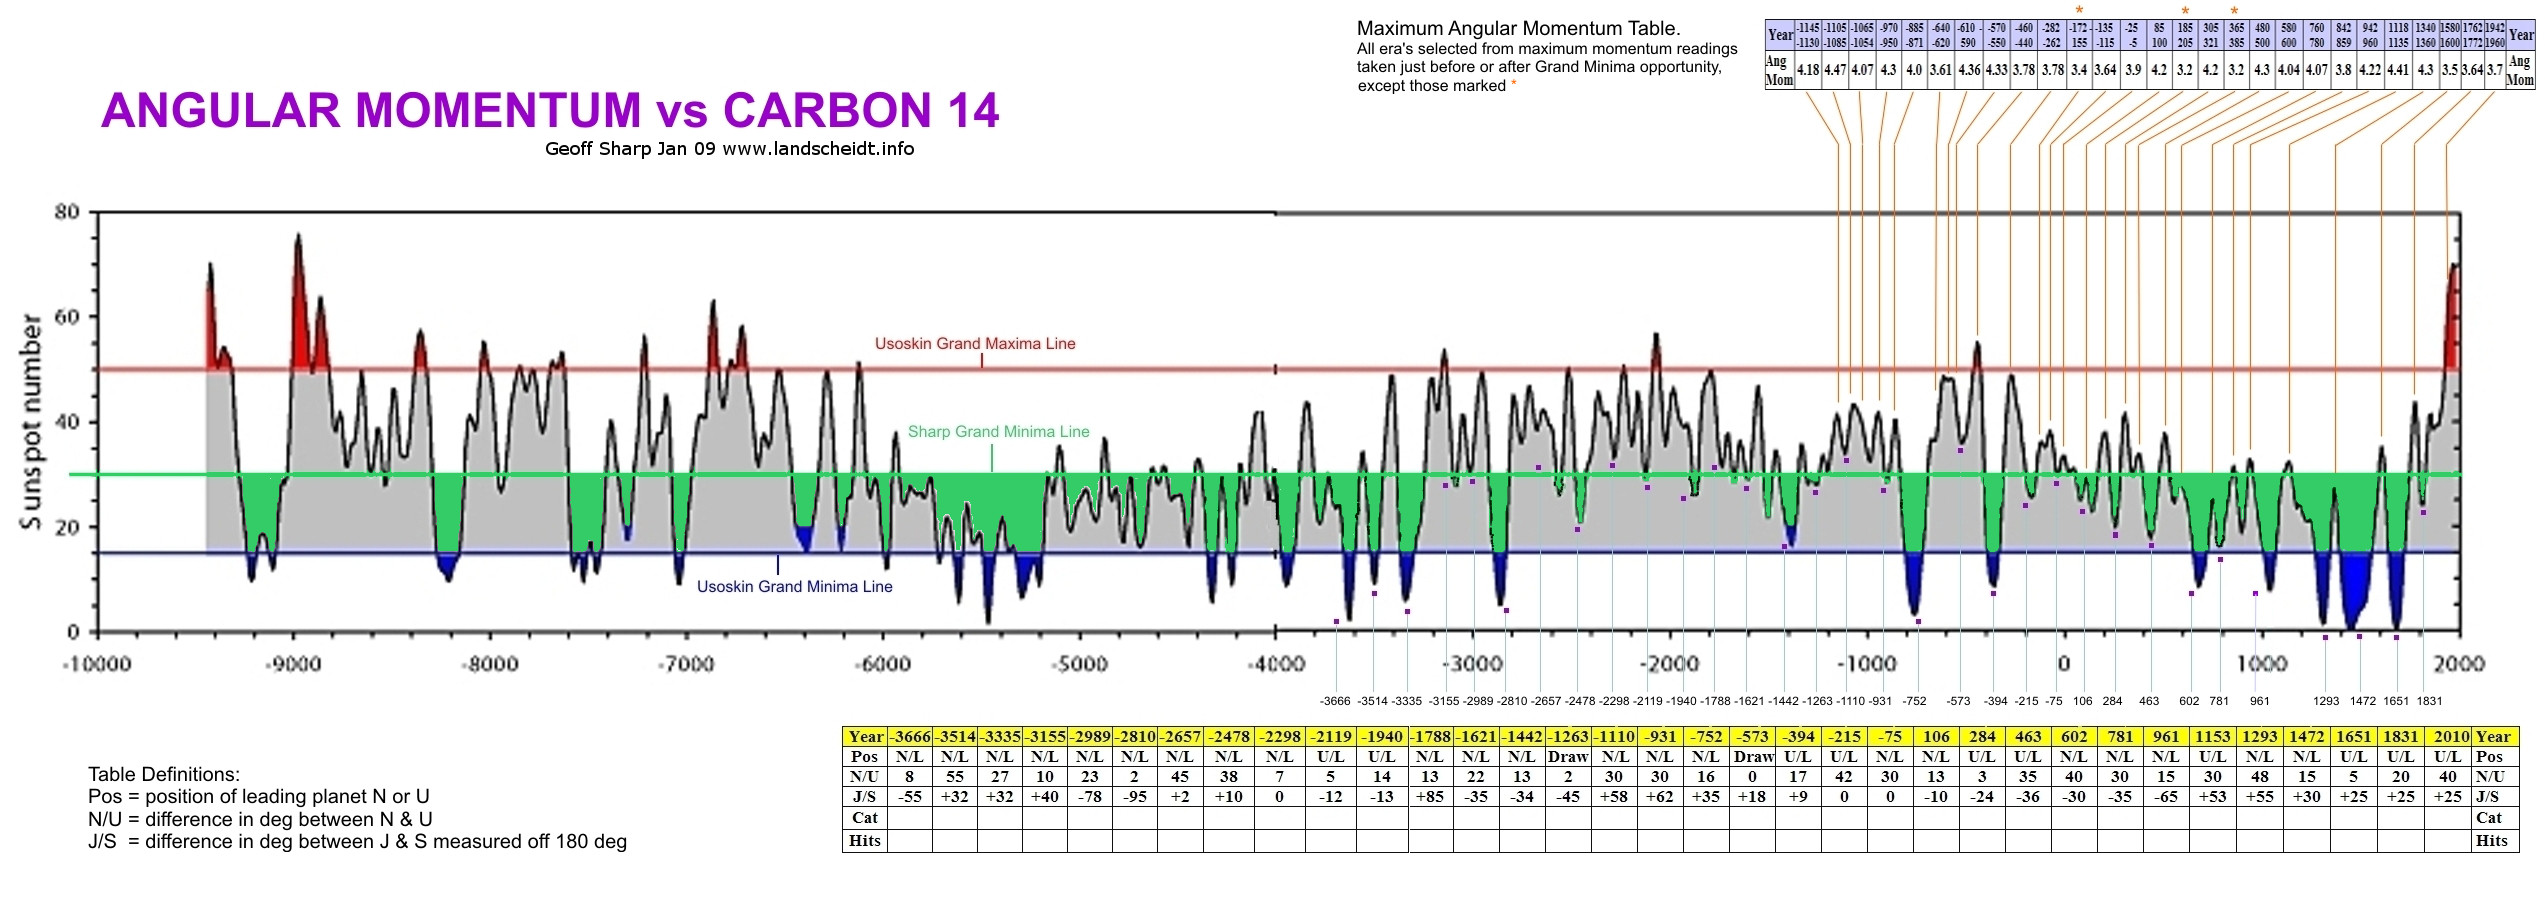
Fig. 5

When looking at solar output over greater timeframes another powerwave is observed. This wave is the Holocene record itself which is determined by the strength of the Disruptive Force over the 11,500 year record. Strong alignments of the outer 4 planets coincide with deep grand minima, while weaker alignments agree with the Medieval, Roman and Minoan Warm Periods. This is also observed in Fig. 6 when comparing the quantified AMP events with the Holocene isotope record.

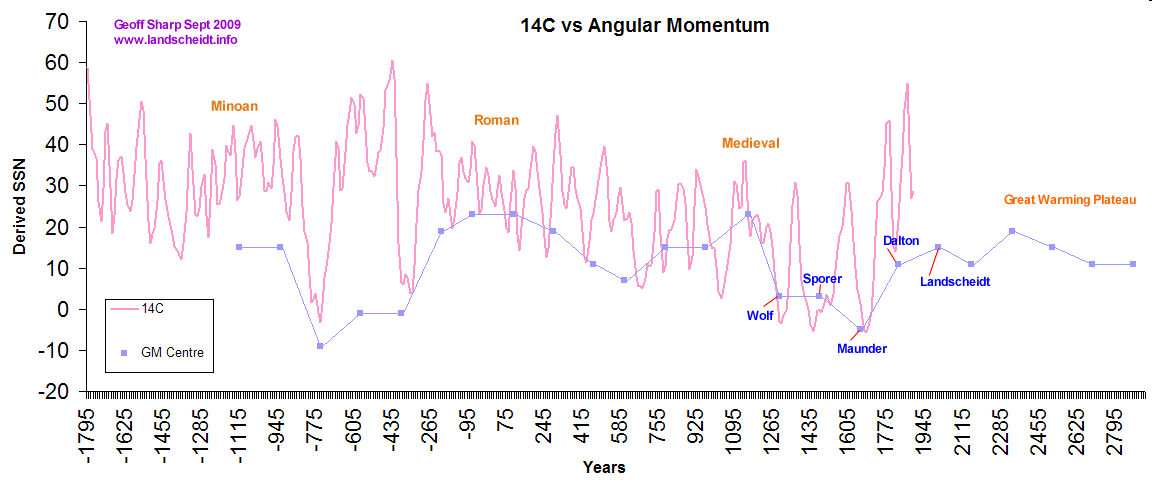
Fig. 6 Figures 5 & 6 plotted from original Solanki (INTCAL98) carbon 14 data

AMT does not include what determines the length of the solar cycle and there are times when the Disruptive Force is weakened because of timing. If the AMP event happens near cycle max the full effect is not realized. It is thought that the Disruptive Force causes a "phase catastrophe" in the Hale cycle whereby one solar pole does not reverse polarity which then takes another full cycle before recovering. If the timing is wrong this will not occur, 1830 is a good example in the modern record.

Understanding the mechanics of both forces makes it relatively easy to understand the rest of Angular Momentum Theory and the power of the Angular Momentum wave, it should also be obvious that because of the inconsistancies in the wave, a firm recurring pattern of grand minima is not possible. There is now a peer reviewed paper by Wolff and Patrone that provides a mechanism for planetary control of solar output. If there are any questions on quantifying the Disruptive Force or any other area I am most happy to respond in comments.

A full version containing more information is available in my paper HERE.

Geoff Sharp.

Comments

Here is some interesting

Here is some interesting research from tallbloke that also shows the same powerwave. Notice how the Dalton Minimum breaks the wave with the Disruptive Force acting on its own. If I am not mistaken the blue line is the amount of planet mass above and below the solar equator (both records highly smoothed). It would be interesting to see if this pattern is repeatable over 1000's of years? (or would the natural orbital precessions move the peak of the wave over time?).... but I would be surprised if this is more than a shorterm artifact of the solar system dynamics that follows the natural AM cycle, which is the Modulating Force. The Disruptive Force is nowhere to be seen with this data set.

Another graph from

Another graph from tallbloke's blog by Tim Channon showing the upslope of the powerwave. This time it is the temperature record which will follow the Modulating Force and Disrupting Force powerwave. But this temperature drop will not be as long and sustained as experienced during the Maunder Minimum or even the Dalton Minimum. Our very small contribution to global warming mainly caused by deforestation and the Urban Heat Island effect will also buffer some of the expected overall drop in temperature. The Disruptive Force will be weak for the next thousand years which might be known as the Great Warming Plateau, our challenge is to accept this is a natural stage of the Holocene cycle that will end soon..

A great graph from Tallbloke

A great graph from Tallbloke which very graphically shows the disruption of the Dalton minimum from the business as usual curve.   The unanswered question is, what force / process causes that massive disruption.  No one has found and shown that yet, if someone can get a good match to that Tallbloke graph, then we might get a better idea of the depth and duration of the Landscheidt minimum we are now entering.

Tim Channon has produced a model, but didn't go on to try and link the curve frequncies to anything solar.   It's also a pity he didn't extend the graph to 2100 and beyond, as looking at it suggests a deeper low than the Maunder.    It's the very last graph that's of interest here.

http://tallbloke.wordpress.com/2012/09/20/how-the-temperature-datasets-t...


J Martin

The disruption during the

The disruption during the Dalton Minimum I assume is the orange line or Lean TSI curve. There is some doubt on the accuracy of this reconstruction but even so the sunspot cycle shows a similar trend. The solar angular momentum graph indeed shows solar disruption during this time that closely resembles the current situation. If the theory is correct we should witness a solar downturn during SC24/25 not as long as the Dalton Minimum.

It will be interesting to see

It will be interesting to see what happens to the powerwave over the next couple of decades. I have a view that the closer the planets are to the plane of the sun's equator during the planetary alignment the larger will be the disruption. This is because the gravitational forces, which ultimately produce the disruption, are strongest when there is an alignment in 3 dimensions. Since the total planetary mass is closer to the sun's equator than at the onset of the Dalton minimum there might be a bigger disruption than expected.

This would be consistent with one of Ian Wilson's papers which showed that the greatest gravitational effect on Earth from the sun, moon (and Venus) is when the moon is in line of nodes that is on the same plane as the sun and Earth. ( Note that of all the planets Earth's orbital plane is closest to the sun's equator.)

REPLY: Hi Brent,  the powerwave is based on solar AM, the vertical alignment will probably have no effect. Gravity is not an issue when determining solar AM in the strictest sense as the Z axis (vertical) is taken into consideration when calculating solar AM. If the powerwave was a function of tidal forces then your comment would be more applicable, I see Leif Svalgaard is now on the Maunder Minimum band wagon, which I dont think will happen.

Brent Walker

Geoff, am an avid follower of

Geoff, am an avid follower of your site and agree that there seem to be a relationship between planet possition and the solar activity level.  I have one question related to power wave etc vs sun position vs center solar system.  Your figure 2 which shows sun looping through the center of the solar system shows that in 2030 the sun loops back to near the center even more close to center than in 2013 yet this has no relationship to the angular momentum chart.  What seem to be undiscussed is what is hapening when the sun itself undergoes thes sweeps around the center.  With the core solid and the huge radiative and convective gas/plasma layers above the core it would seem the the core would have to phyically interact with these other layers causing disturbed flows which would last a relatively long time given the changing direction and rotational spin of these unusual loop of solar motion take years.  It might be that these loops to the center (caused by the planet positions) cause the core of the sun to react differently causing disturbed flows which could interact with the magnetics on the sun.   If that were true, then in some cases the path of the loops by the sun into the center of the solar system would cause a weakening of activity because the disturbance would slow solar rotation (flows) or increase activity because they added to flows...bill

REPLY: Hi Bill, thanks for your question. Evidence suggests that the CLOSER the path of the Sun is to the SSB the higher the solar output (SC19), this can only happen when N/U are together. But there are conditions where this can be reversed. If the cycle before has experienced a strongly disordered orbit and a corresponding breakdown of the solar cycle which is thought to disrupt the Hale cycle, it doesn't matter how close the orbit comes to the SSB as the solar poles are negated. We should see evidence of this phenomenon after cycle max of SC24. The important aspect is to observe how far the disordered orbit travels away from the SSB which mirrors the amount of perturbation on the AM graph.

Pennlion

OK but the thing that grabs

OK but the thing that grabs me is the loop the sun takes through the SSC around 2030 is even tighter (more sharp) than it is during SS24.  It would seem that this would cause an impact in solar activity such that it could drive the sun into even quieter activity than is predicted by SC5 unless there was a similar second loop around the SSC in the 1820s that also didn't have an effect. I believe this is possible since the path the sun takes inward toward the SSC around 2030 is from a similar direction vs the SSC as in SC24.  I believe there are natural reasons why the sun has a variable nature and that the planet positions are involved.  I also believe that these solar loops into the SS center are involved. The answer could be a combination of effects which disturb the flows in the various layers on the sun which would be related  to why solar rotation rate varies from the solar equator to the poles.  bill

Pennlion

Many thanks go to Carl's brother Dave for providing the Domain, Server and Software.