Share
Original article date: Nov 6th 2008

Some time ago while researching some of my interests in areas such as meteorology, the cosmos and perceived man-made global warming I came across Carl's website and in particular a very interesting graph which Carl Smith created showing an extension to Dr. Landscheidt's work. After studying Carl's graph it became apparent to me that Neptune & Uranus are responsible for Solar Grand Minima as well as Solar Cycle Modulation. In this article I will present Solar System Charts and Sunspot charts which correspond with some of the Angular Movements below in Carl's graph.

The basic theory on how Neptune & Uranus control Solar Grand Minima and Solar Cycle Modulation is as follows: Shown in Carl's graph is a wave modulation mainly created by Jupiter & Saturn together (top of wave)and Jupiter & Saturn opposing (bottom of wave) which effectively is the momentum engine of the Sun, the top of the wave is strong, the bottom is weak (weaker means stronger cycle). Every 179 yrs Neptune & Uranus gather behind Jupiter (the largest gravity source besides the Sun) giving it extra momentum force and IF Saturn is on the other side of the Sun, the "down" cycle is shortened and not as weak because of the reduced momentum to Saturn....this coincides every time with less sunspot activity for the last 1000 yrs at least. Just discovered in an extension I recently finished to Carl's graph back to 900AD is another line up that also causes Grand Minima before the Medieval Warm Period, over time Jupiter and Saturn gather on the other side of Neptune & Uranus causing disturbance at the top of the "wave" and substantially shortening the "up" cycle. Neptune and Uranus are the controllers of the 2 main drivers creating angular momentum, they can add or take away that momentum. The sunspot cycle modulation follows that control or momentum curve as shown in a graph later in the report. I believe we can now confidently predict Solar Grand Minima and Solar Cycle Modulation strength.
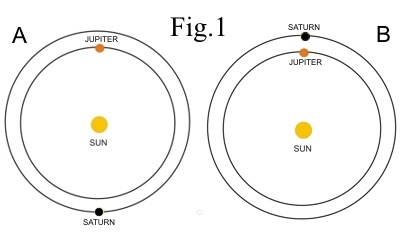
Fig.1 shows the 2 planetary positions that create the majority of angular momentum in our solar system. "A" corresponds with the bottom of the wave in Carl's graph and "B" with the top of wave. The resonance created from large strength in "B" and near zero strength in "A" as Jupiter & Saturn balance each other out.
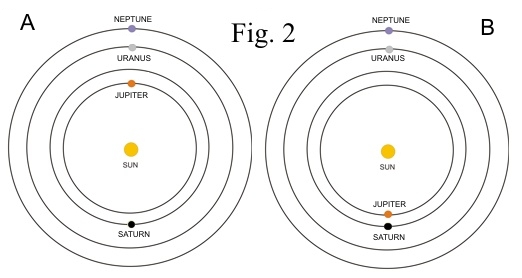
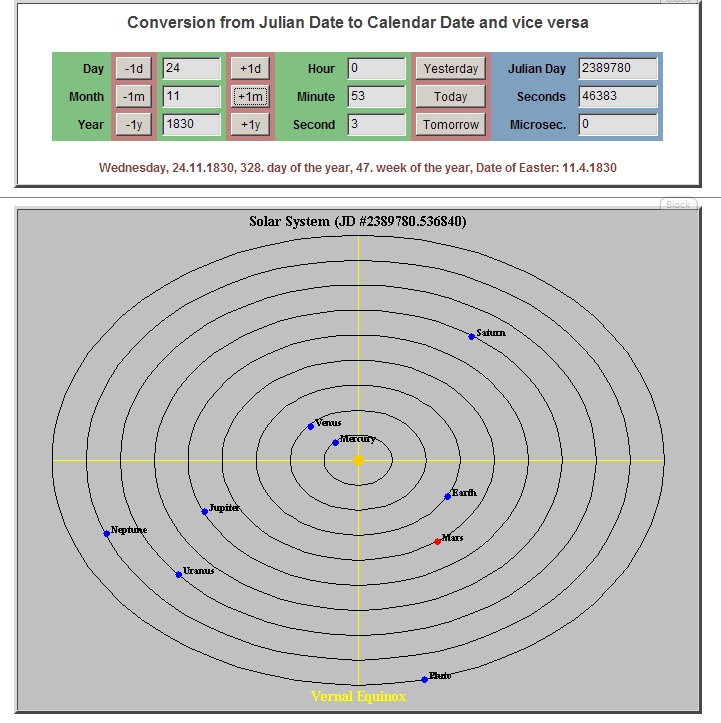
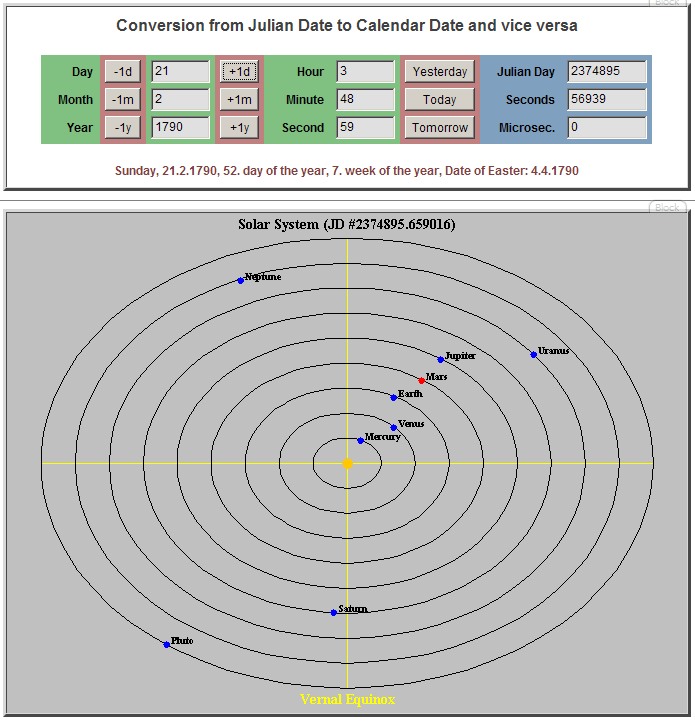
Fig.2 shows the 2 planetary positions capable of creating Grand Minima. "A" robbing Saturn at bottom of wave and "B" robbing Jupiter/Saturn at top of wave. Both positions responsible for the recurring "camels humps" in Carl's graph
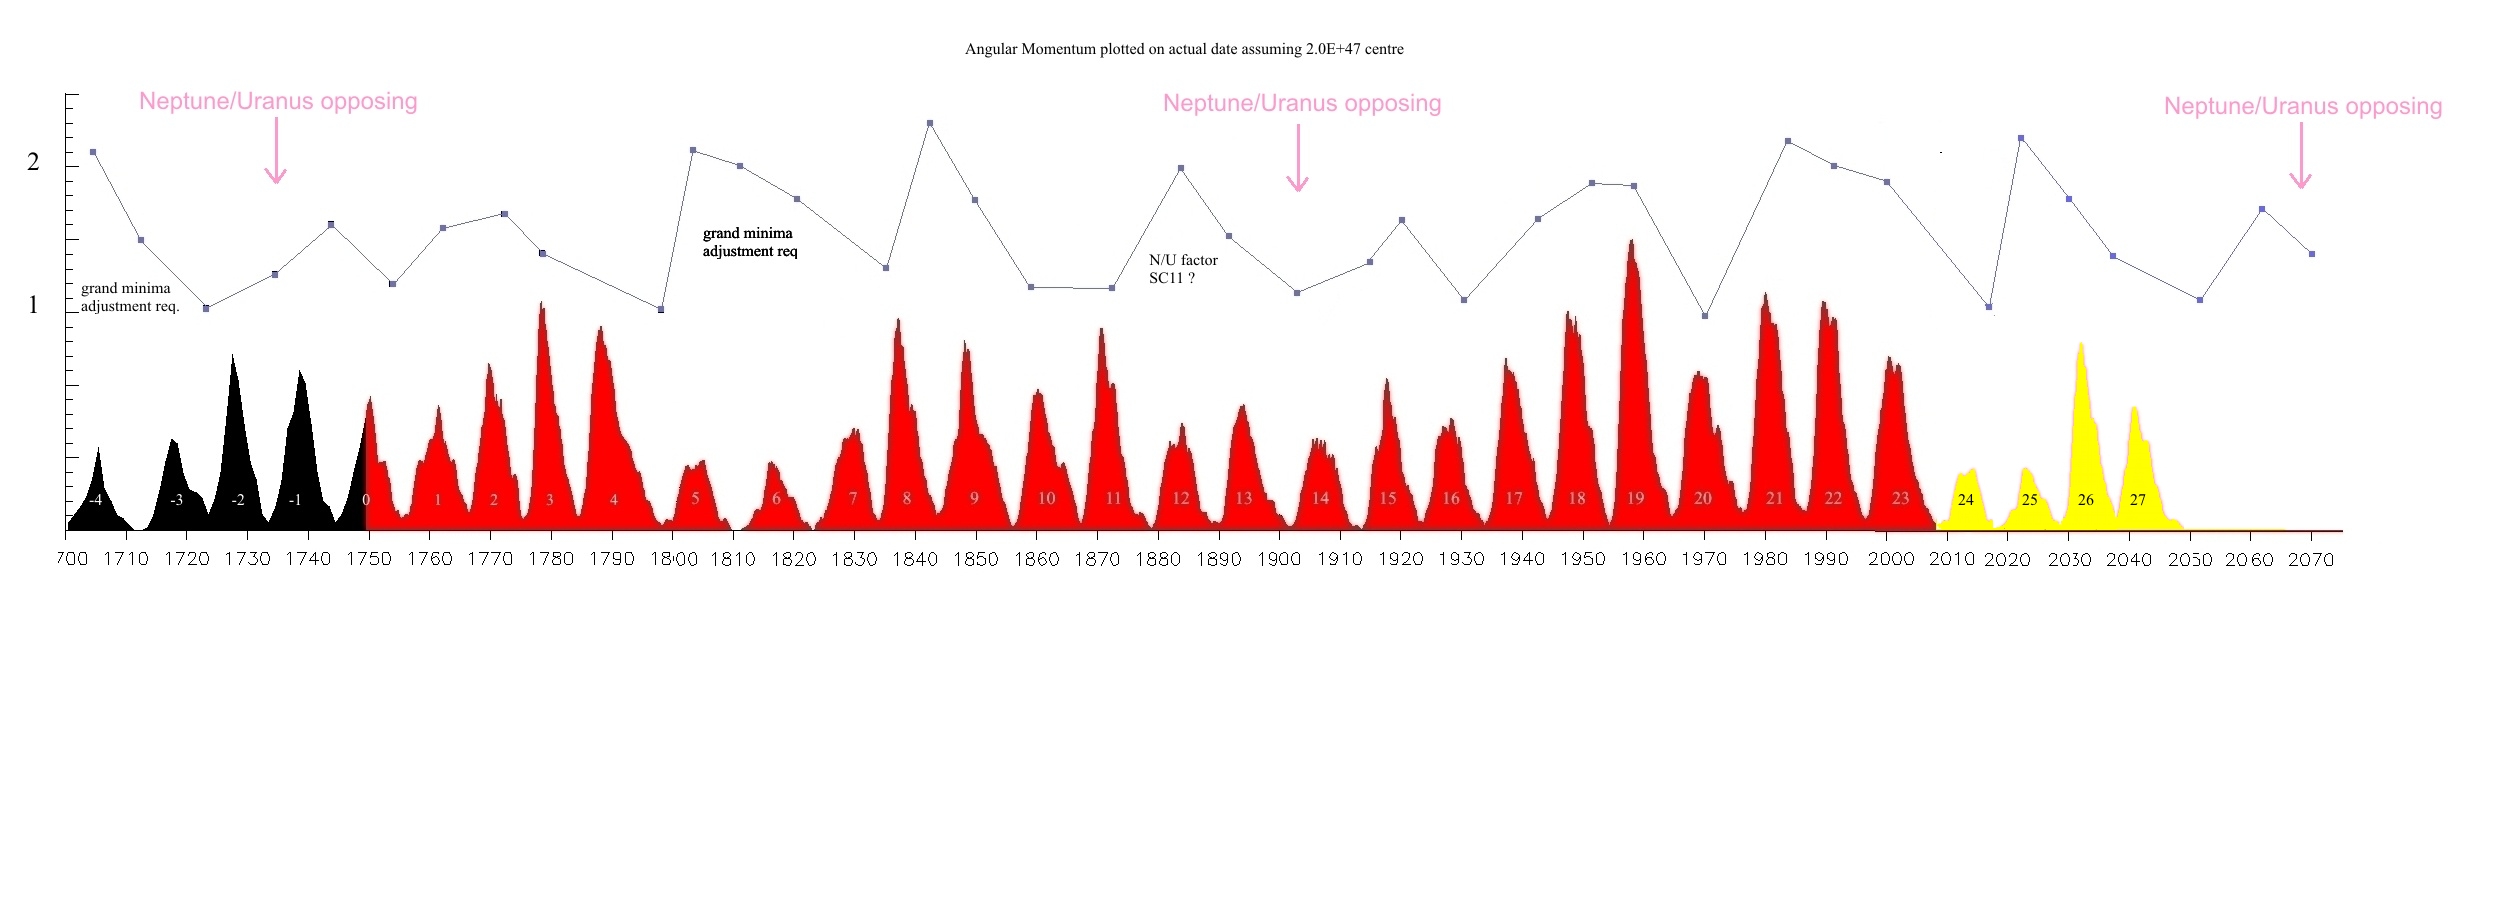
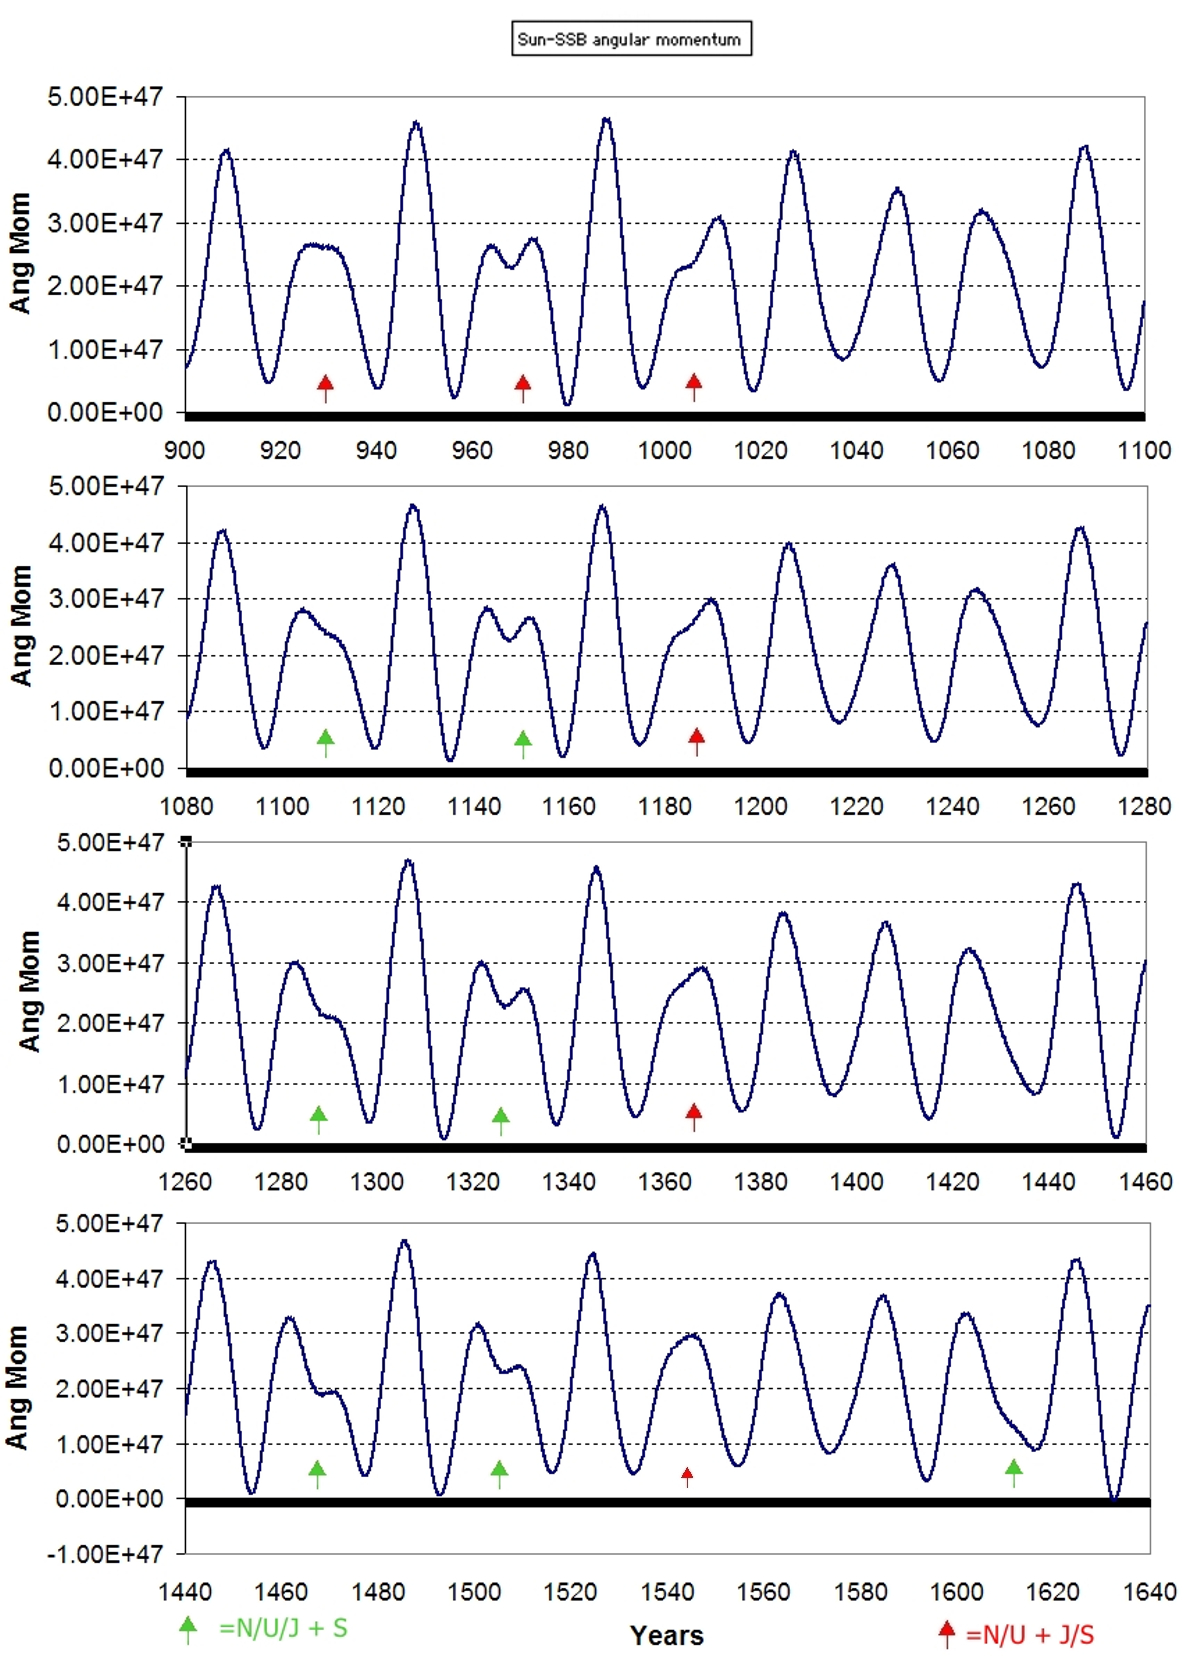 Carl's original graph above.
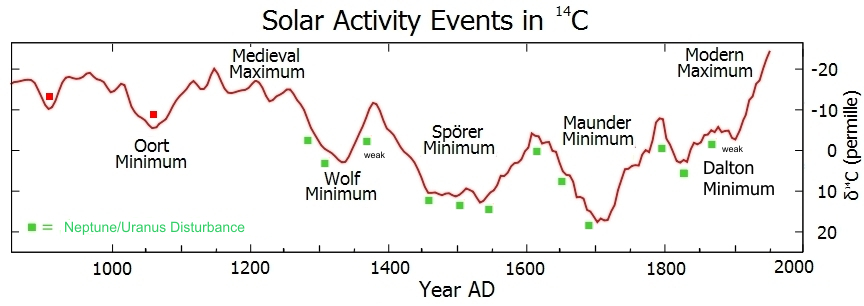
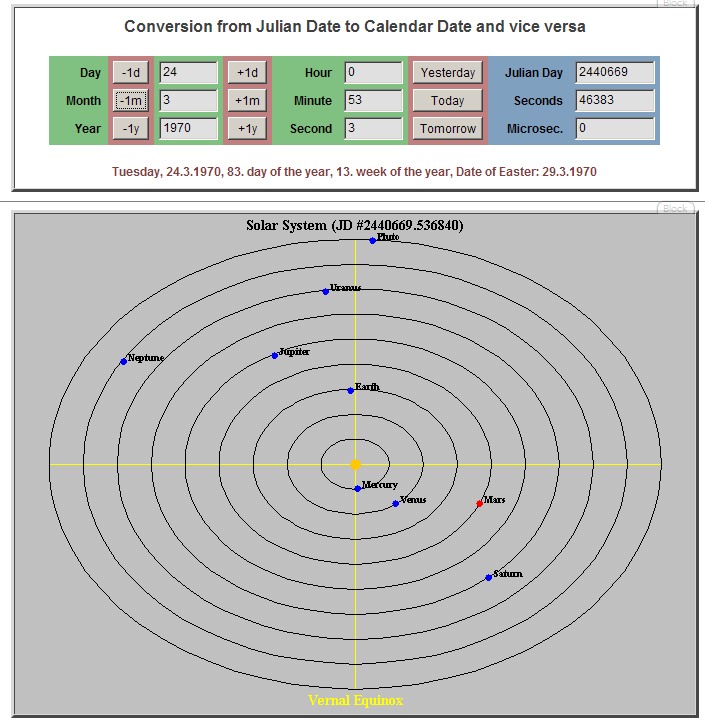
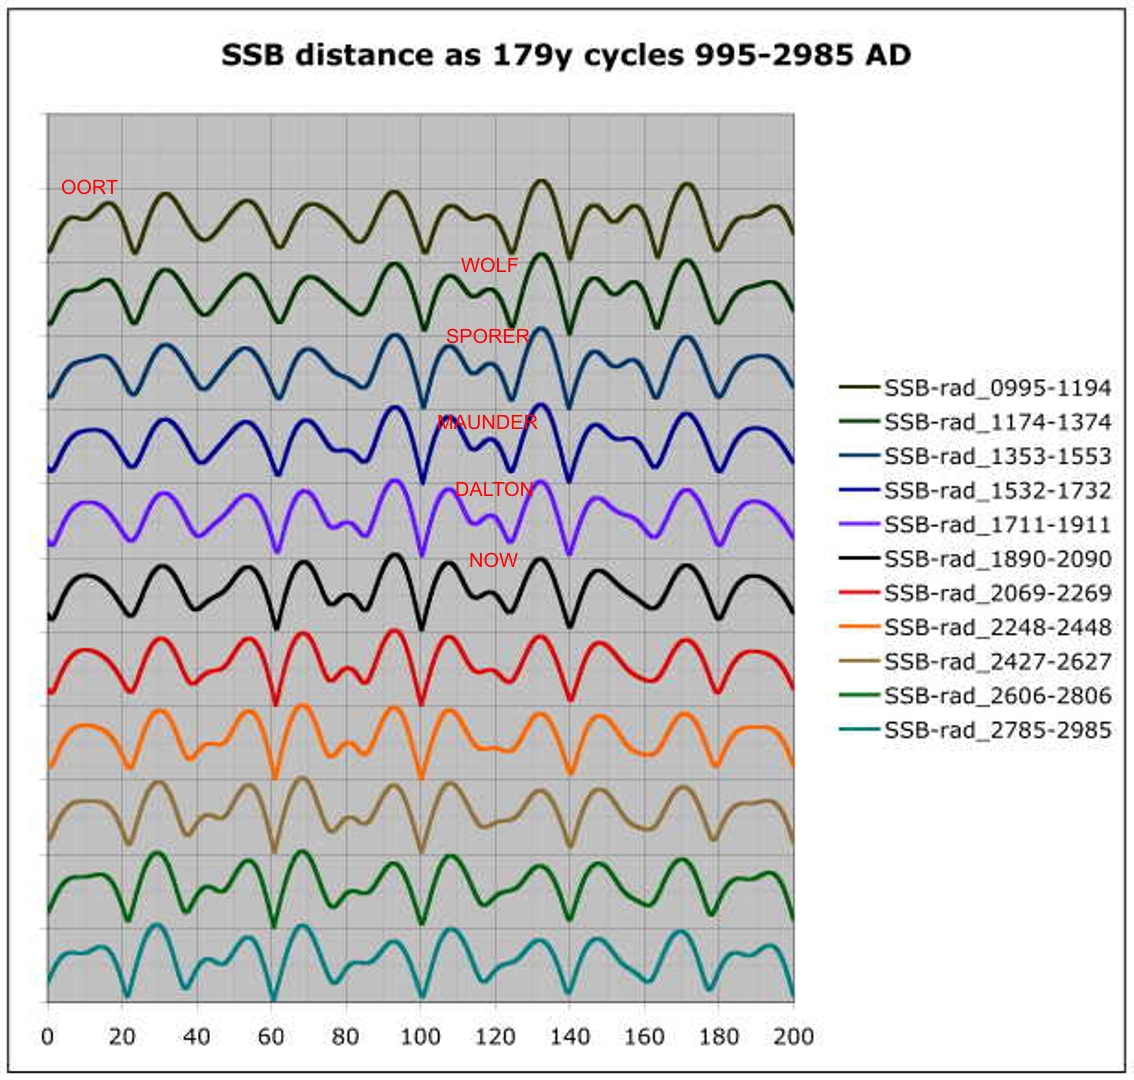
Carl’s graph is a representation of the suns angular momentum as affected by all planets of our solar system. The interesting features in particular is the camel shaped humps (green & red arrows) that occur every time during Grand Minima and more recently (967, 1005, 1290, 1470, 1650, 1790, 1830, 1970 & 2010). Researching the planetary positions I found a recurring pattern, it seems that Neptune and Uranus aligning with Jupiter and Saturn opposing (doesn't have to be in perfect alignment) creates a disturbance which changes the regular pattern. This disturbance coincides with the Dalton, Maunder, Sporer and Wolf and Oort minimums. In the past we had a build up of solar cycle strength immediately before Grand Minima which is due to the extra momentum in the system from N+U. When we get a Grand Minima event, the next 2 cycles after are always very weak even though Angular Momentum is strong, this phenomena is still a mystery but perhaps it simply takes time to "restart the system". There are 3 phases to consider but only if the angles of J+S are favorable as N+U start to come together( and I am just discovering that it doesnt happen often, 1280 to now is truly a golden period), basically we have a strong lead up of solar peaks before grand minima event then if the partial line up (1st phase) is strong enough we have grand minima like we did for the Dalton, Maunder, Sporer and maybe Wolf. Next we have 2 cycles of very reduced activity followed by the optimal lineup of N+U+J with S opposite which starts the cycle again until we get the remaining partial line up and if that is strong enough we get more grand minima action. The Sporer and Maunder experienced all 3 phases but the Dalton only endured the first 2 (the J/S angles are now weakening) and thats why we didnt get a grand minimum in SC20 (first phase, partial lineup). The Oort minimum steps away from the usual pattern because of the weaker lineup of J+S, but shifts to the alternate line up of N+U & J+S opposing . The Neptune/Uranus factor is a lot weaker around the time of the Medieval Warm Period (Jupiter & Saturn not aligning) with very little disturbance (not unlike the overall weakening trend we are starting to experience now), but still I predict a weak solar grand minimum (see prediction at end of report). Compare Carl’s Graph to the solar system views below, especially 1651, 1830, 1790 and (2010 near end of report). Note: Solar system views dont take into account the slight elliptical orbits present in the system that do contribute to the overall momentum modulation.

 .
. 
This view above also coincides with my birthday The chart below shows the partial line ups that can cause a Grand Minima Event and if not a large degree of reduced solar activity.
Here is a graph I made showing sunspot peaks plotted against calculated cycle angular momentum and the obvious correlation. No allowance made for inertia or grand minima effects (history shows the cycles stay low for 2 cycles regardless of momentum after minima event).

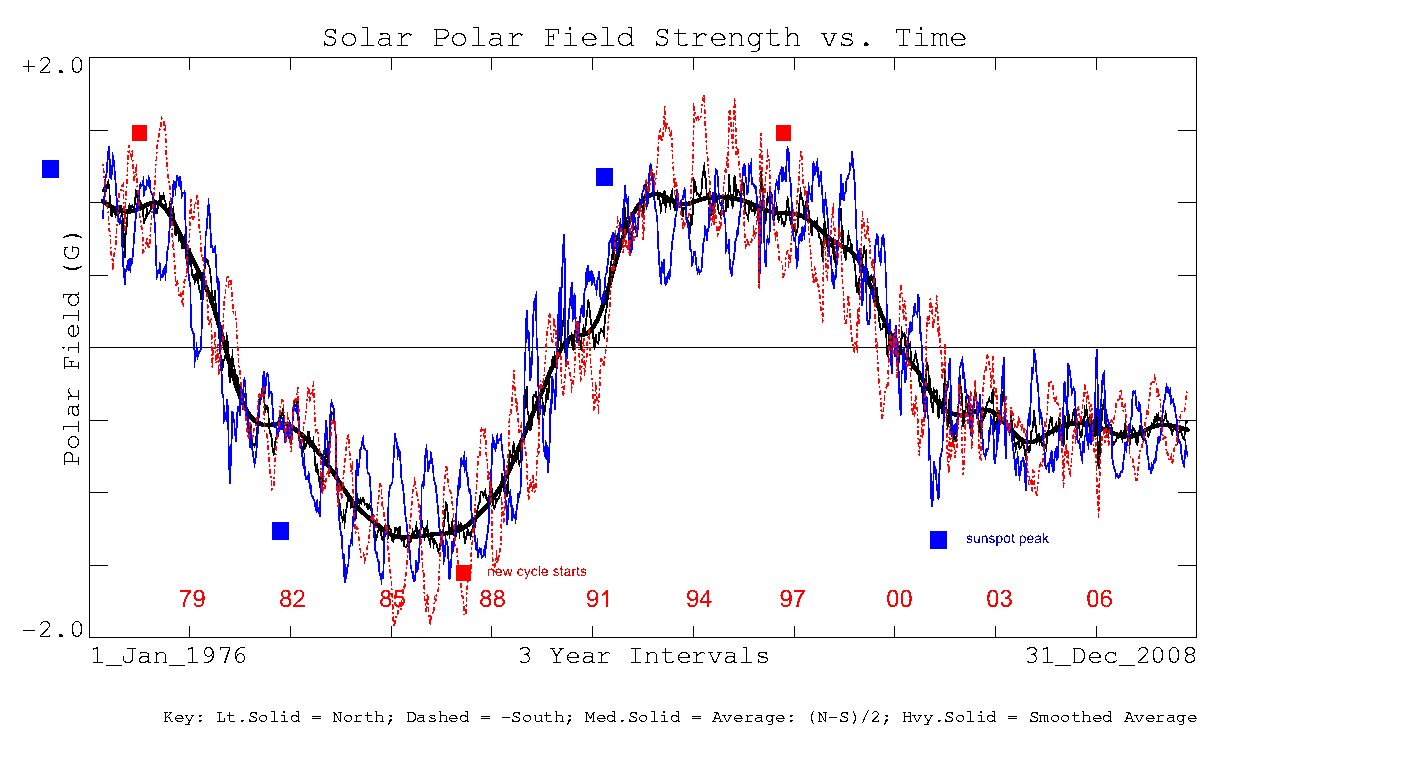
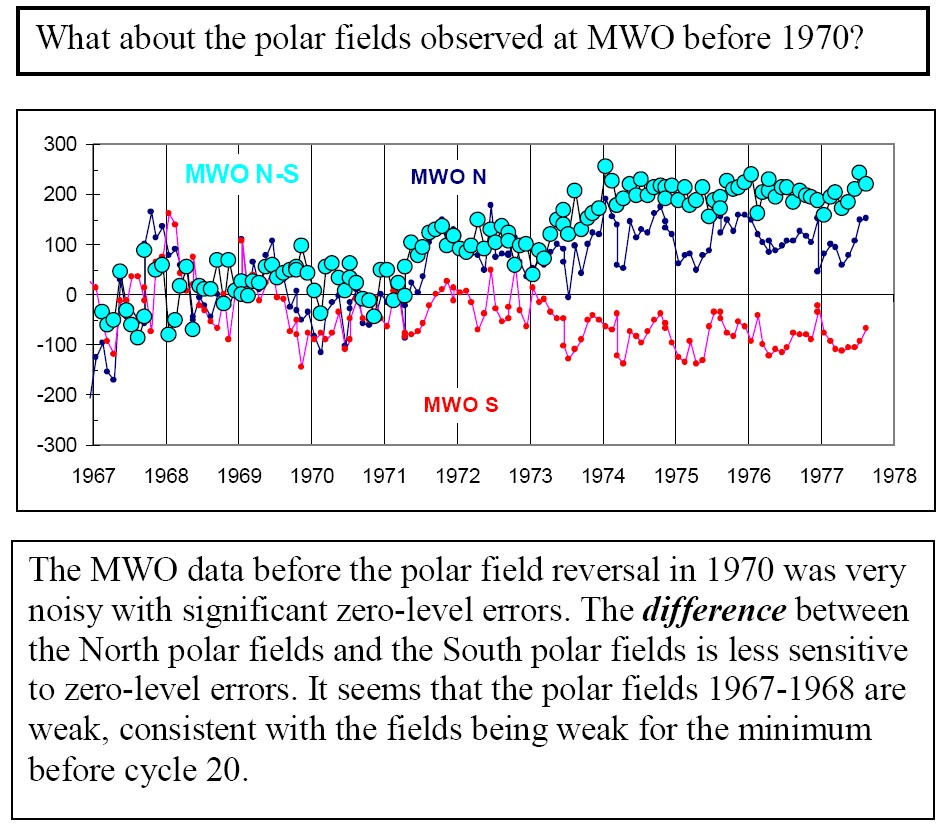
This graph answers lots of questions, but also creates some new ones. Why doesnt the Dalton continue in 1830. Did SC11 cause SC12 to be reduced (SSB graph shows disturbance). Some might ask why the angular momentum is so high in 1880 right near the opposition of N+U? Answer: All planets create angular momentum and in 1882 they are nearly all lined up except U. Most notable is that there are no high peaks during times of reduced momentum. UPDATE Ian Wilson's latest paper now addresses these questions, see link here http://landscheidt.auditblogs.com/2009/01/11/does-a-spin%E2%80%93orbit-coupling-between-the-sun-and-the-jovian-planets-govern-the-solar-cycle/ The Neptune, Uranus factor could be effecting the Sun is several ways, perhaps causing a slowdown in the rotational difference at the high and low latitudes thereby reducing the input to the solar dynamo. There are several papers that discuss this observed phenomena during past minima and I am currently researching the differential latitude speeds but finding the data hard to come by. Its also been noted the Solar polar magnetic strength is substantially reduced at present which could be as a result of the rotation change if it is occurring. There are at least 2 papers that talk about a “phase catastrophe” during the Maunder and Dalton minima implying either a period when the solar poles are both the same polarity for an extended period or the cycle goes to 22 years instead of 11, I also think its highly possible that both poles could fluctuate between positive and negative through the entire cycle if the new polar inflows are not strong enough to change the polarity. This could also dramatically slow down the production of sunspots. As can be seen from the graph below with normal fluctuations and a low solar pole strength that would certainly be possible. It would be interesting if possible to see the polar strength of 1790 but it has only been accurately recorded since 1967, but notice the low polar strength pre 1970 in Dr. Svalgaards' graph of the MWO data. http://www.leif.org/research/Polar%20Fields%20and%20Cycle%2024.pdf
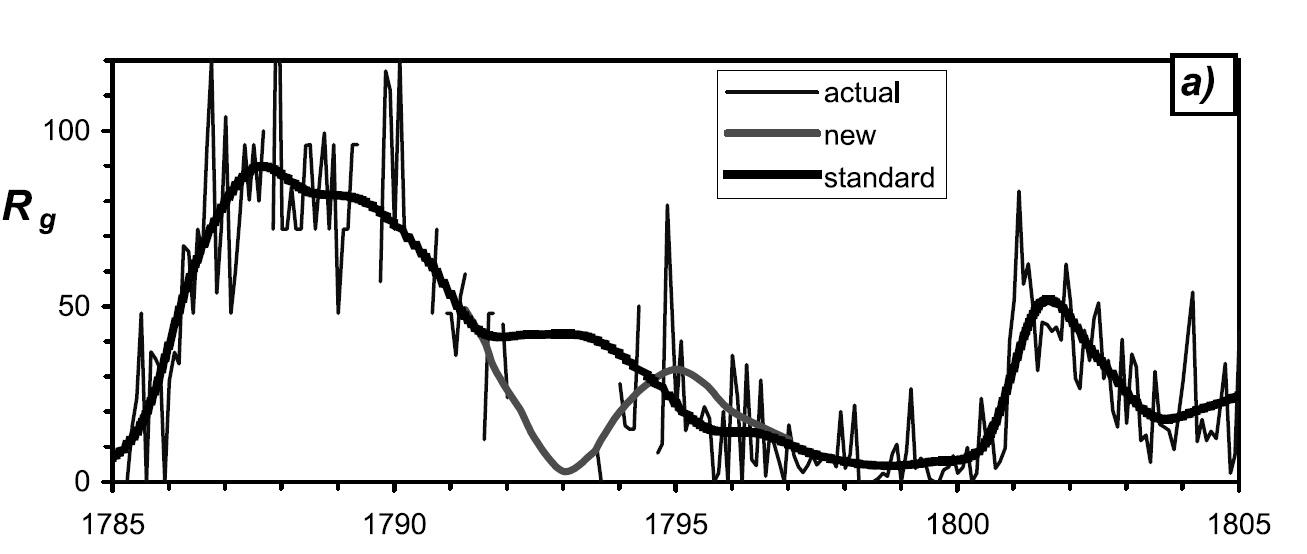
Other points of interest to the theory is SC4 (1788 peak) that lasted perhaps 16 years and is questioned by I. G. Usoskin, K. Mursula, and G. A. Kovaltsov at http://cc.oulu.fi/~usoskin/personal/2002GL015640.pdf as being 2 cycles recorded incorrectly (records before 1850 are considered shaky). The planetary lineup of that period is very similar to today and their revised sunspot group SC4 could mirror SC24.
The chart below kindly supplied by Carl shows angular momentum from 995 - 2895. The green arrow represents the optimal line up of N,U,J with S opposite . The Oort minimium steps out of line as the line up goes out of sync, the planets dont quite come back exactly the same each 179 yrs and it seems from the Wolf until now is a window of line ups that might take 1000's of years to return, during the medieval warm period J+S were poorly aligned as the phase gradually shifted. The MWP could be stated as a phase transition period, further bolstering the theory.
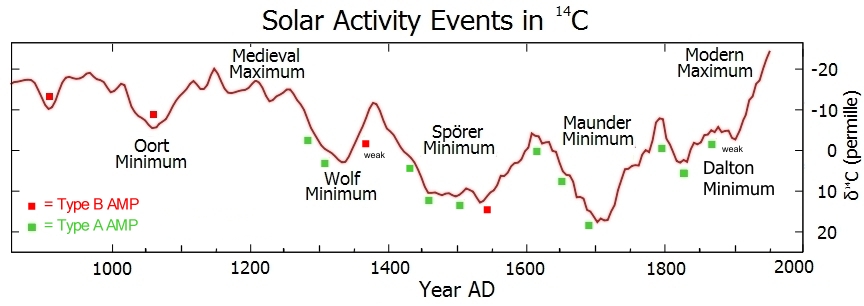
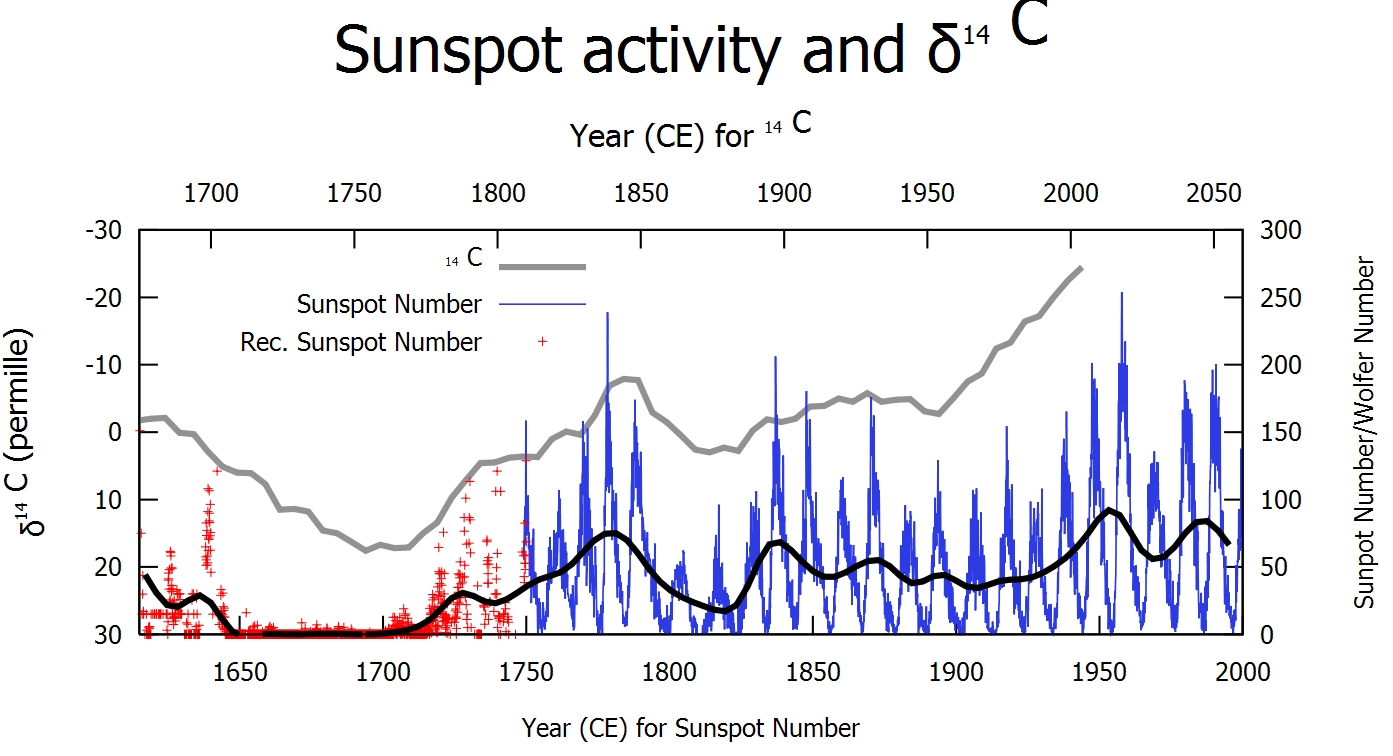
The C14 chart from Wiki shows via the green & red dots the same position as above as the green & red arrows in the SSB graphs. The green dots represent the N/U disturbances and as can be seen the previous minima began at the partial line up stage and except for the Dalton continued thru the optimal alignment and on to the remaining partial line up in the phase before returning to "normal". 1970 failed to be strong enough to start a Solar Grand Minimum explaining the extra heat in the system, SC21,22 & 23 were let off the hook this time. So the typical pattern as can be seen in Carl's graph above is partial/optimal/partial, but the ideal time for this being between 1280-1830, before and after this period the Jupiter/Saturn alignments begin to weaken and shift. Grand Minima conditions DO NOT occur every 179 years but only if Jupiter & Saturn are in the right position.
As you can see we are due for a slow down if we follow the same pattern but perhaps not as big a slow down as past minima.
Prediction: Some points to digest, the strength of the Neptune/Uranus influence seems to be waning, in the past 4 grand minima the Sun went into Grand Minima on the partial lineup of Neptune/Uranus as can be seen in the C14 Wiki graph and the green squares (also look at the 995-2985 graph showing the changing trend). This time around we past that stage (1970) without falling into grand minimum and the Dalton minimum shows a weakening trend coming out of minimum not long after the best lineup of Neptune/Uranus (1830) at the time.
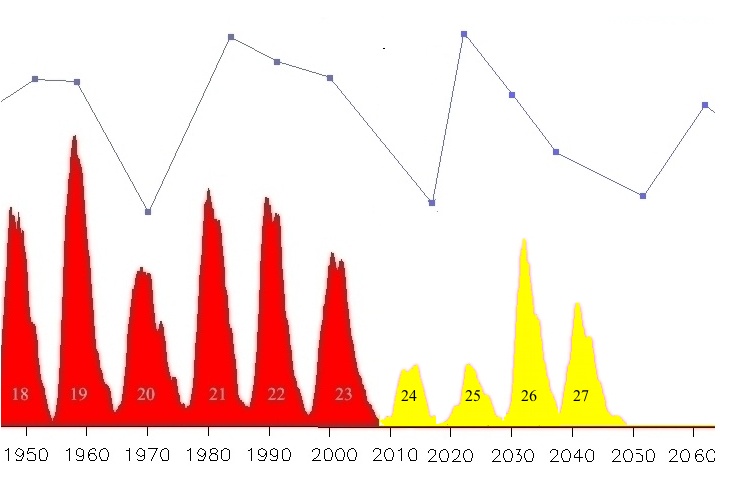
Based on this information I predict a short Grand minimum beginning during Cycle 24 which may possibly look like the end of SC23 or be a very low peak in its own right lucky to rise above 50 SSNmax, followed by another low peak. The SC24 peak is particularly hard to predict, the planetary alignments suggest early 2010 or early 2014 but the sunspot peak (see below in Desmoulins and Hung's graphs) is currently running ahead of the alignments by at least 3 years (Neptune/Uranus doing their thing). Going on history the SC24 peak may get back into line with Desmoulins plot like it did in 1805, if so Feb 21 2010 is looking like a good date, if not early 2014. UPDATE... Ian Wilson's latest paper has raised some doubt in my prediction, he has noticed Grand Minima or low cycles always have the conjunction of Jupiter & Saturn before solar cycle max, SC24 needs to have its peak after 2011 to fall into this category, it will be interesting to watch.
There is still a chance that SC24 could look like the end of SC23 like it may have in SC4...this is new ground and if so that will push out or perhaps add another small cycle. Click on the chart to view an expanded version from 1700AD-2070AD
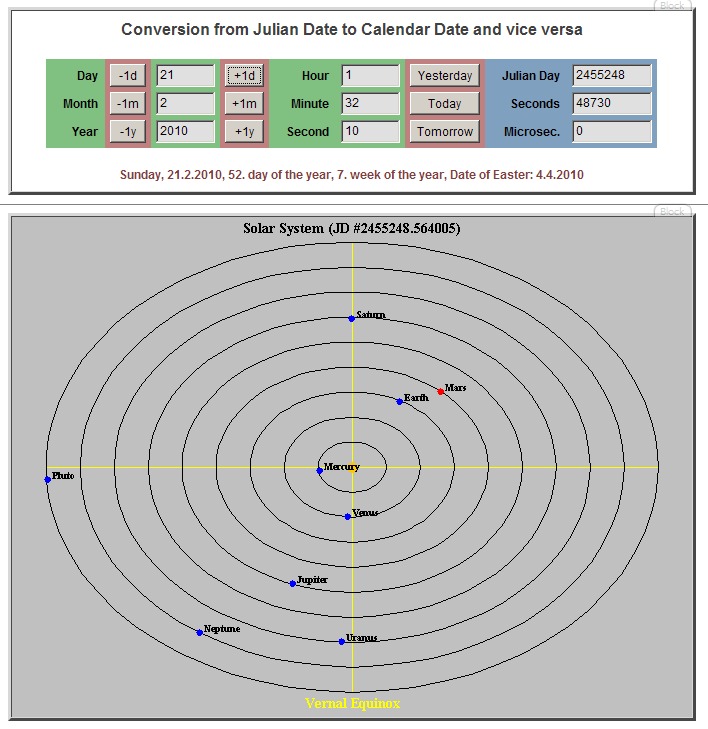
Note the alignment on Feb 21 2010 (also coincides with my birthday) Both Cycles coming together J+V with E apposing and N+U+J with S opposing. (See the J+E+V cycle below)
The SSB and Solar System data has been cross checked.
The Solar System Viewer can be seen at: http://math-ed.com/Resources/GIS/Geometry_In_Space/java1/Temp/TLVisPOrbit.html Could Tidal forces control the 11 year sunspot cycle? Here are 2 pieces of work that look at smaller 11 year cycles (approx) that theorize on Jupiter/Earth/Venus rotations that line up with sunspot cycles. Here NASA has reported on possible links between sunspot cycles and the planetary movements http://gltrs.grc.nasa.gov/Citations.aspx?id=330 EDIT: The NASA paper basically looks at the Heliocentric sysygies of Jupiter, Earth and Venus and how they line up with sunspot peaks. Jean-Pierre Desmoulins has also done some great work on his site http://pagesperso-orange.fr/jpdesm/sunspots/ where you can view this graph below showing that alignment (green peaks are J+E+V most aligned with the Sun and solar cycle peaks shown in red). Notice how the alignment gets slightly out of sync around 1790 and now, when out of sync we experience much less solar activity...Neptune and Uranus are close together at these times possibly dragging the sync out of line but it should return like it did in 1805. Certainly worth further investigation.
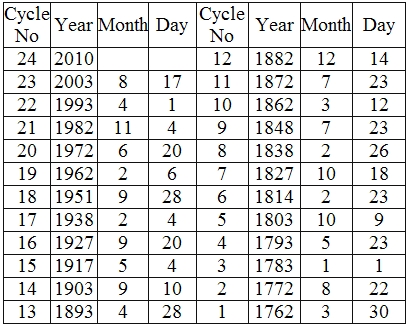
The table is a plot of J+E+V alignments with each date corresponding with the green peaks on Desmoulins graph above. The odd cycle numbers are J+V with E opposing and even is J+E+V aligned. The G/O rule keeping mainly true. These alignments naturally include the Sun. A Similar graph from the NASA paper below.
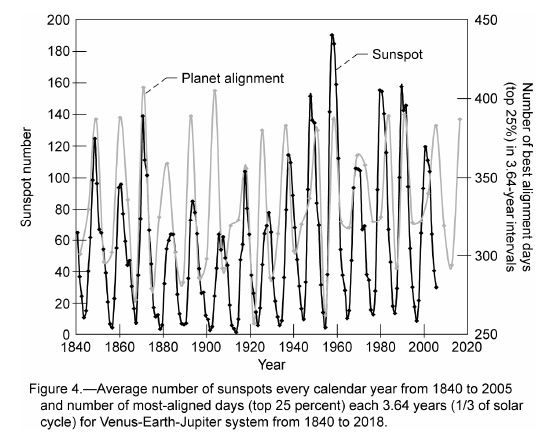
The compelling evidence is that both graphs plot 2 cycles that although slightly different in length remain in step with one another.