Ocean Sea Surface temperature anomaly for July 30 2011.
There is only one component in my mind that can stop another massive winter occurring in the Northern Hemisphere during 2011/2012. The Sun will need to come out of its slumber very quickly and start producing monthly smoothed sunspot numbers above 70. Last year I made a Northern Hemisphere prediction in July that some thought was highly unlikely " I predict the extra boost from my predicted solar grand minimum along with the current oceanic conditions the next northern winter (2010/2011) will experience conditions similar to the Little Ice Age (1250-1850)"
That prediction came to pass with most of the Northern Hemisphere experiencing severe cold and snow records along with massive floods along with huge cyclone Yasi smashing into Australia's north east coastline. Central England saw the second lowest temperature recorded since 1659. Already in the Southern Hemisphere, winters have been colder than normal with South America again taking a solid hit with very large snowfalls and very low temperatures. But there were some inconsistencies observed over the western Europe winter that deserves more scrutiny. During December 2011 the AO was very negative and we saw very cold temperatures in the UK as the jet stream funneled cold Arctic air over Western Europe. But that changed dramatically in January 2011 when the AO turned highly positive until about May. What was observed is important as the jet stream remained strongly contorted but now brought warmer winds from the Atlantic to Western Europe but maintained a very strong cooling presence o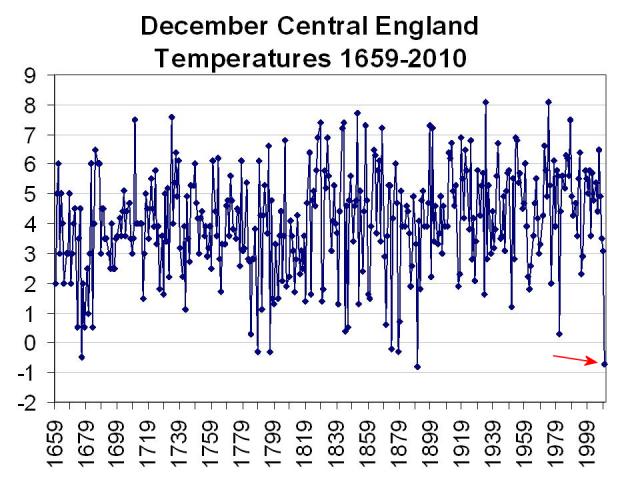 ver eastern Europe and North America. The jet stream in the Southern hemisphere showed the same characteristics, it didnt matter what shape the polar vortexes were in, the jet streams maintained their influence by funneling polar air during respective winters. I think this phenomenon is solar induced and brought about by the increased incidence of low pressure systems in both hemispheres. I have been watching the pressure systems around Australia for the past 40 years and I cant remember a time when there was so many persistent low pressure cells that have caused monumental flooding on our continent. The higher incidence of low pressure cells along with strong high pressure cells causing the changes to the jet streams irrespective of other local weather and ocean patterns in place. The pressure changes coincide with heavily reduced solar EUV output and a lower cooler upper atmosphere.
Joe Bastardi commented on the unexpected results from the last US winter during a strong La Nina, basically the jet stream overrode the normal pattern expected which saw brutal conditions across the north east. For these reasons I expect more of the same to follow this winter but predicting which area will experience the worst conditions is difficult at this early stage. Last year everything was in place for a strong La Nina to build as well as a strong chance of a negative AO to form late autumn.
Looking at the ocean temperatures in the graphic at the head of this article the cold water "V" left over from the recent La Nina is apparent in the Pacific. There is a small warm water pool off the coast of South America and coolish water above Australia and New Guinea. The easterly trade winds have decreased but still maintain a flow across the Pacific. All this adds up to a Neutral ENSO position which could persist or go either way. The Southern Oscillation Index which records pressure difference between Darwin and Tahiti is just edging towards a La Nina position so there are conflicting indicators at present. Look for a warming of the water above Australia and New Guinea before a decent La Nina will be able to form, moist warm rising air is needed over this region to feed the Walker Circulation that strengthens the trade winds which in turn raises the thermocline in the east which starts the cold water upwelling off the South America Coast.
Looking out over the coming months I am going for another La Nina to form but my confidence level is not high. The AO has been around neutral since May which leaves plenty of room to go negative as autumn rolls out. The AAO is very negative at present which is in complete contrast to last year, if it turns highly positive it will boost any La Nina that is trying to form. There could also be some extra cooling from the recent volcanic activity.
So the prediction is for another massive Northern Hemisphere winter but at this stage it is unclear who will be affected most. We will have to get used to these events for the next 20-30 years if my solar predictions pan out. The AO graph will be interesting to watch along with the ocean temperatures as the winter approaches. Now is the time to prepare for the coming winter....prices will rise.
There will be future updates to this article as the seasons progress.


Daily updated sea surface temperature anomaly.
UPDATE: Aug 16th.
An ominous sign of the power of the jet stream is currently being experienced by New Zealand.
"The bitterly cold southerly blast has now brought snow to most of New Zealand, closing roads, some airports and cutting power to thousands.
Snow has made roads impassable in many areas of both islands.
MetService head forecaster Peter Kreft told NZPA the polar blast was "of the order of a 50 year'' event and warned it could last for several more days.
"It's a once in many decades event. We are probably looking at something like - in terms of extent and severity, maybe 50 years,'' he said."
"The extreme conditions have been caused by opposing weather patterns, said Niwa principal scientist James Renwick.
"We've got quite a big storm that's a low pressure centre east of the country. That's come down from the North Tasman Sea and has brought quite a bit of moisture with it.
"And that's met up with a cold air stream coming from the far south, so that's cooled down that moist air and caused all the precipitation - be it rain or snow or whatever."
He said the air stream is flowing all the way from Scott Base to New Zealand around the edge of an anti-cyclone."
http://www.nzherald.co.nz/nz/news/article.cfm?c_id=1&objectid=10745187
http://www.nzherald.co.nz/nz/news/article.cfm?c_id=1&objectid=10745581
The last time such an event was recorded was during the 1930's, the jet stream diagram below showing the rush of freezing air from the Antarctic.
Also of interest is the changing sea surface conditions over the Pacific equator, a tongue of cold water is forming close to Sth America with perhaps some warming above Australia. The PDO index for July has dropped suddenly to -1.86 which is substantial and adds further weight towards a solid La Nina forming. The AAO is predicted to go positive over the next few weeks and if so will add more strength to any building La Nina.

UPDATE: 26th Aug.
A big change in the SST's today. Overnight a colder tongue forming off Sth America with the water above New Guinea also warming suddenly, this is a similar format to May 2010 as shown in my animation.
http://tinyurl.com/2dg9u22/?q=node/221
The SST's of the northern Pacific in deep cold PDO mode, has the hot area in the central northern Pacific been flowing towards New Guinea to strengthen the Walker Cycle? Perhaps one case of the PDO driving ENSO?
UPDATE: 7th Sept.
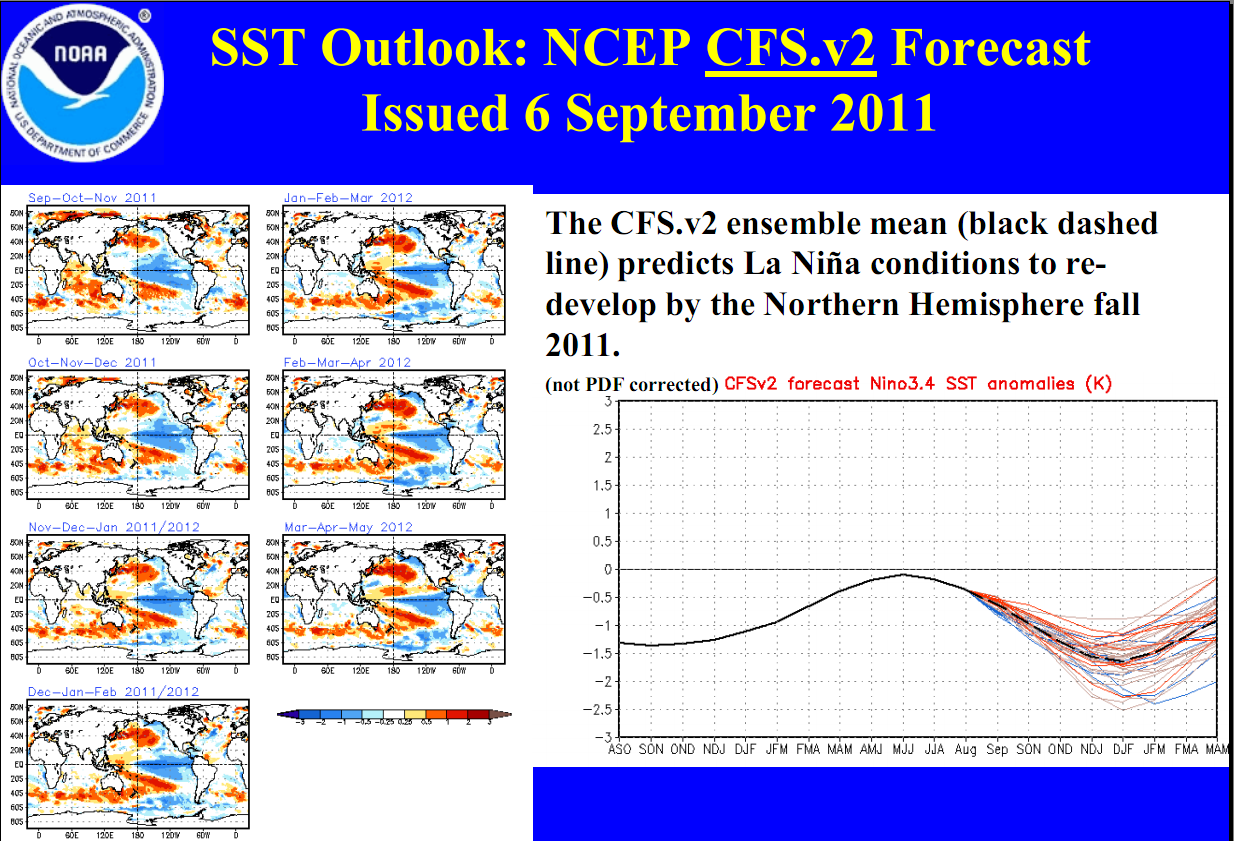
The NOAA ENSO forecast is now showing a high likelihood of a strong La Nina forming later this year. Of interest is the future diagrams showing increased warming over the western pacific which will be interesting to compare at a later date. The sub surface temperature graphics showing the cool area now near the surface in the east with a large body of warm water in the west not yet near the surface. If this body rises to the surface there will be an impact on the Walker circulation pump. Click on the images for a full size view.

There is also a big jet stream from Antarctica about to hit Australia that will be worth following. More details to follow.
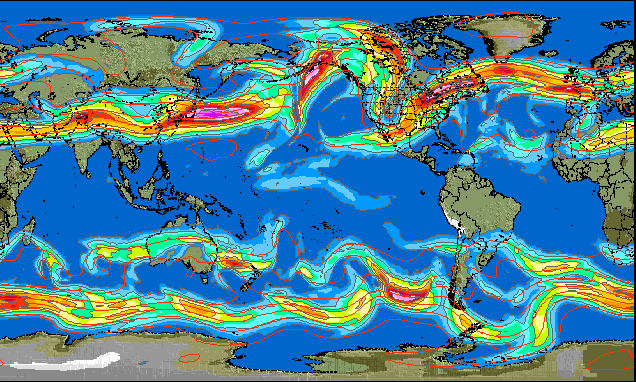
Click on the pic for up to date jet stream position and forecast.
I
UPDATE: 10th Feb.
The northern hemisphere winter was patchy through December and January but has now come on in full force. The Great Freeze of 2012 has made world news with unfortunately many deaths and hardship. The Arctic Oscillation (AO) turned negative at the end of January which heralded the onslaught to come. I have put together a list on metrics that show the breakdown of events and how this phenomenon plays out.
Click on the images for a full size view
| Great Winter Freeze of 2012 Metrics |
|
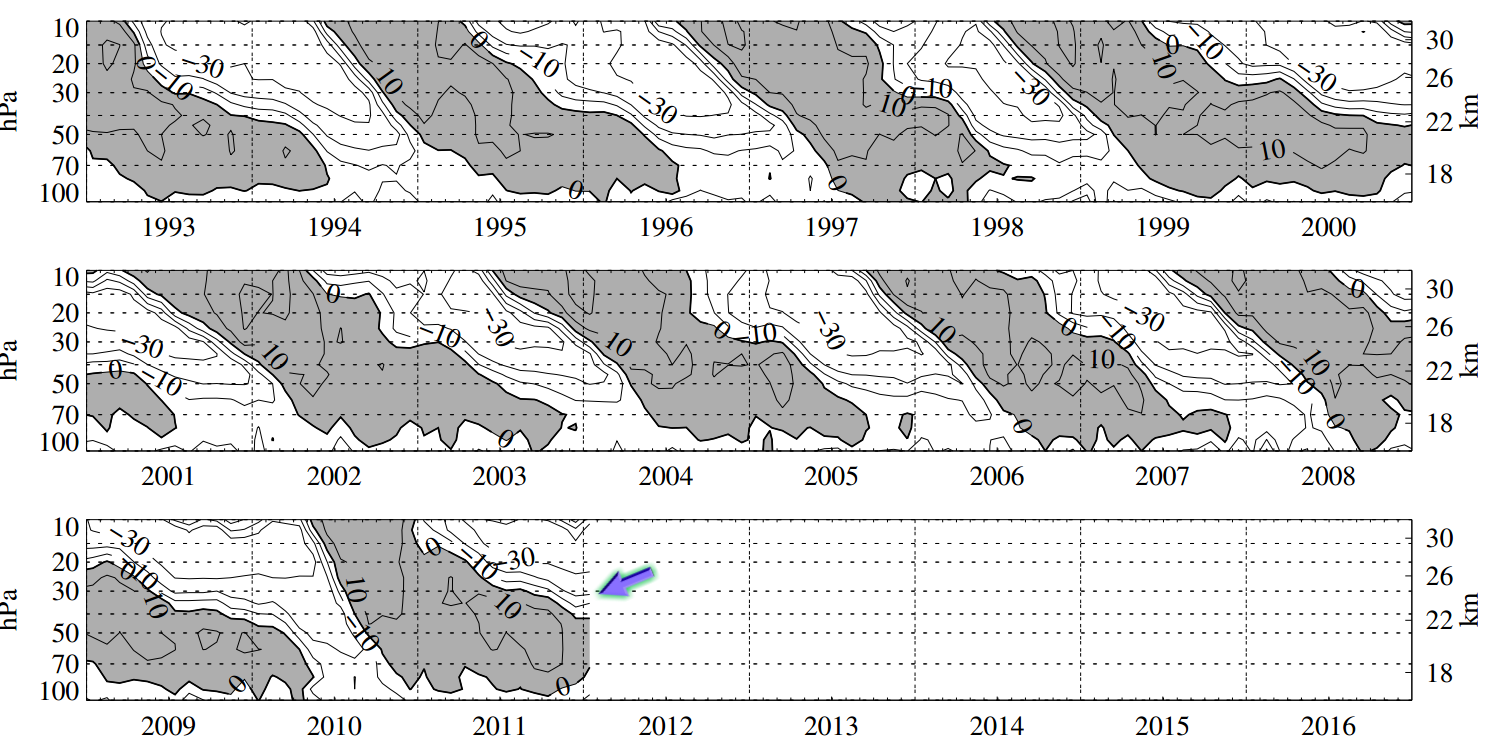 |
QBO diagram taken from the University of Berlin. The darker area is the westerly flow and the white area is the easterly flow. The break up of the northern polar vortex is the key to realizing a neg. AO. It is thought planetary waves traveling up from the equator to the pole is fundamental for this process. An easterly QBO encourages this process, which can be seen to be developing at higher altitudes. |
 |
Upper Stratospheric zonal winds show a sharp decline at the end of January. Baldwin et al and others suggest this is one factor required for the intrusion of the planetary wave to the polar regions. This metric showing the easterly phase of the QBO kicking in. Note: QBO easterlies are stronger during low solar output. |
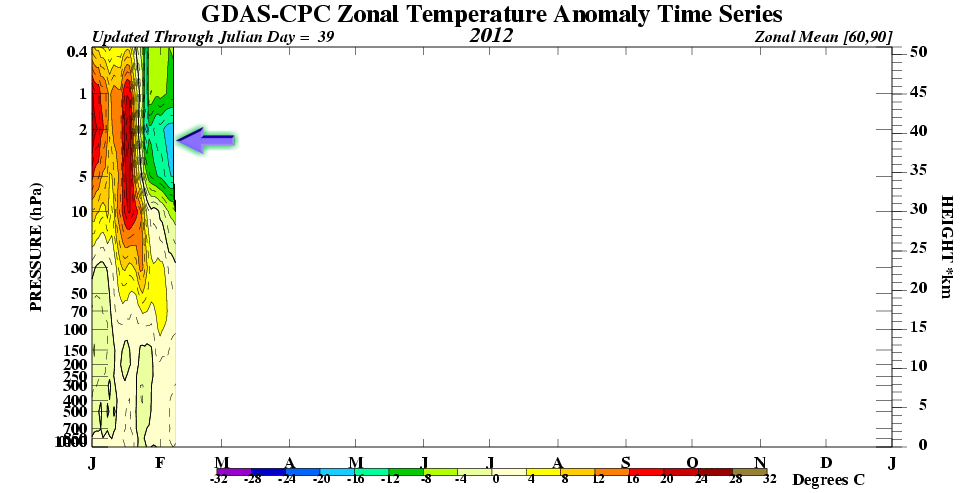 |
Upper Stratospheric temperatures have shown an overall cooling which is perhaps unexpected but when looking at the spatial patterns (next) there are also warm areas that are the signature of a collapsing polar vortex.
|
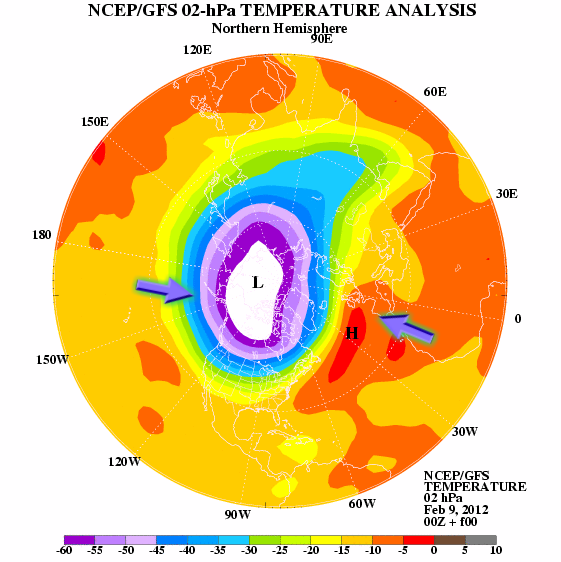 |
Upper Stratospheric temperatures shown in a different format show the distribution of temperature across the pole. Notice the warm area is over Europe. The temperature spatial patterns align with the ozone spatial zones.
|
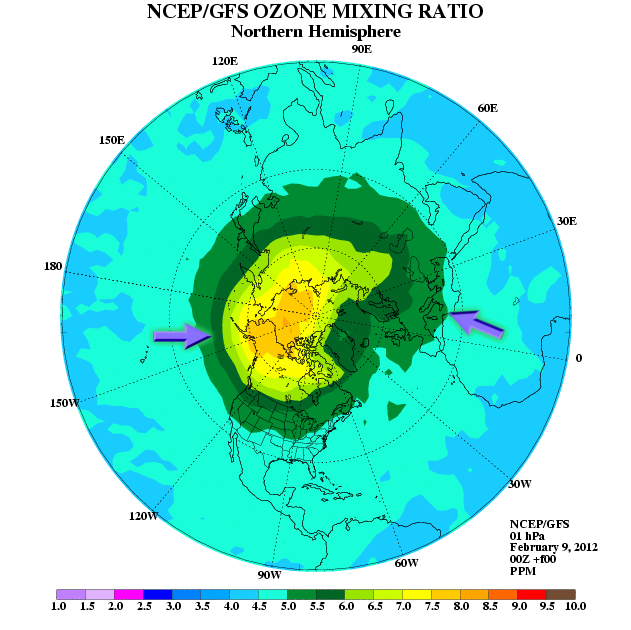 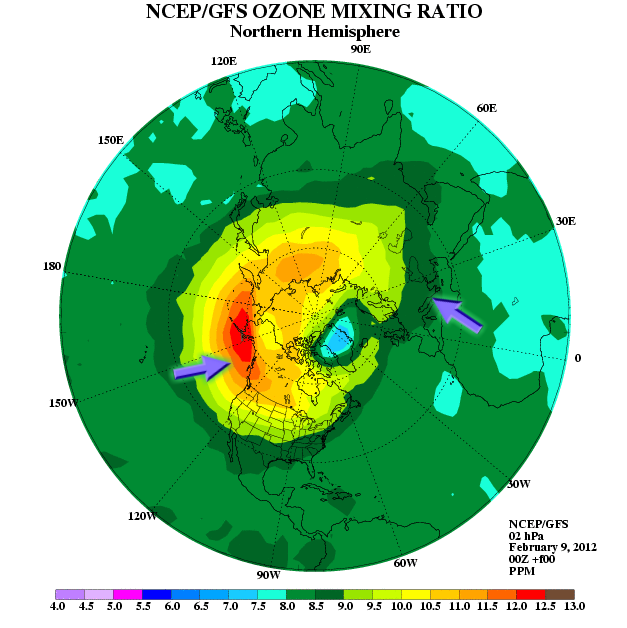 |
Upper Stratospheric polar ozone mixing ratio plots showing a distribution bias away from Europe. The higher ozone quantities are possibly from 2 sources. Low solar activity promotes less NOx activity which destroys ozone at higher levels, and ozone from lower levels is transported via the now productive planetary waves.
|
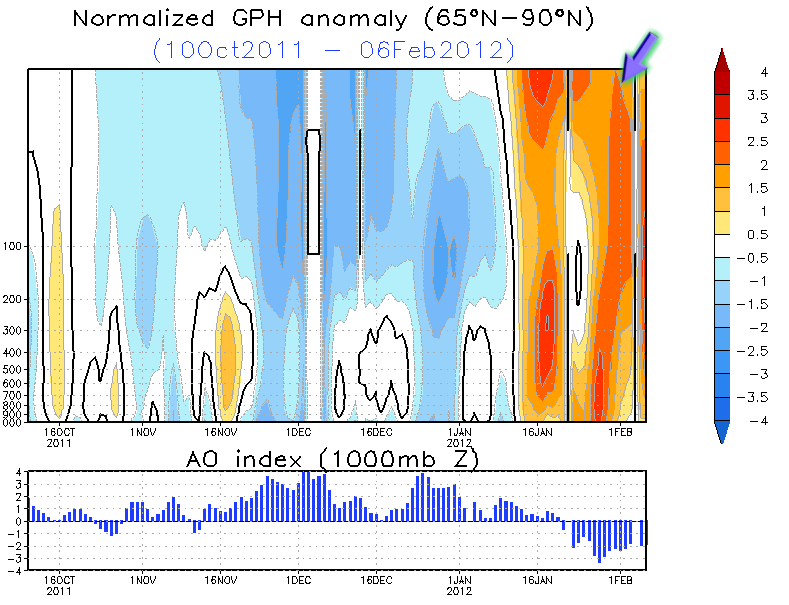 |
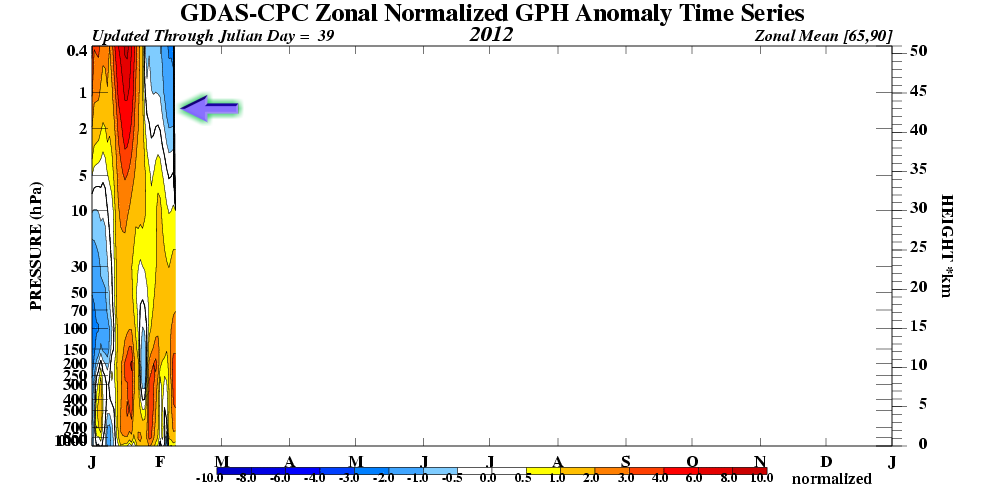
The all important northern hemisphere vortex graph along with the AO position showing the sudden weakening of the polar vortex (red) in January. Notice the slight lag in timing of the AO index. A negative AO changes pressure patterns at higher latitudes which influence the shape of the jet stream. |
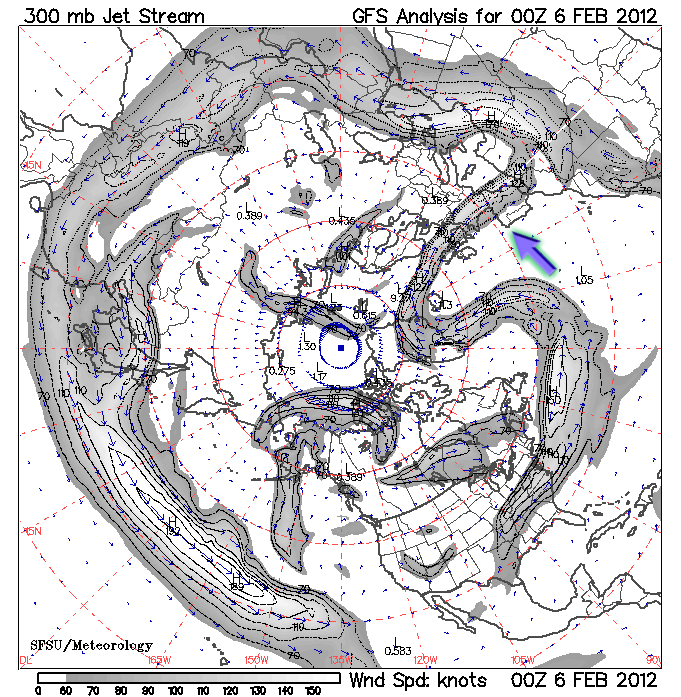 |
The end result felt at the surface. The negative AO changing the shape of the jet stream that now favors central and western Europe. Cold Arctic air is drawn down over Europe. Nearly all severe global weather events of the past few years are aligned with a jet stream climate forcing. The position of the AO and AAO in the south determining which part of the globe is affected. |