Share
Click on the graphs for a full sized view and then magnify.
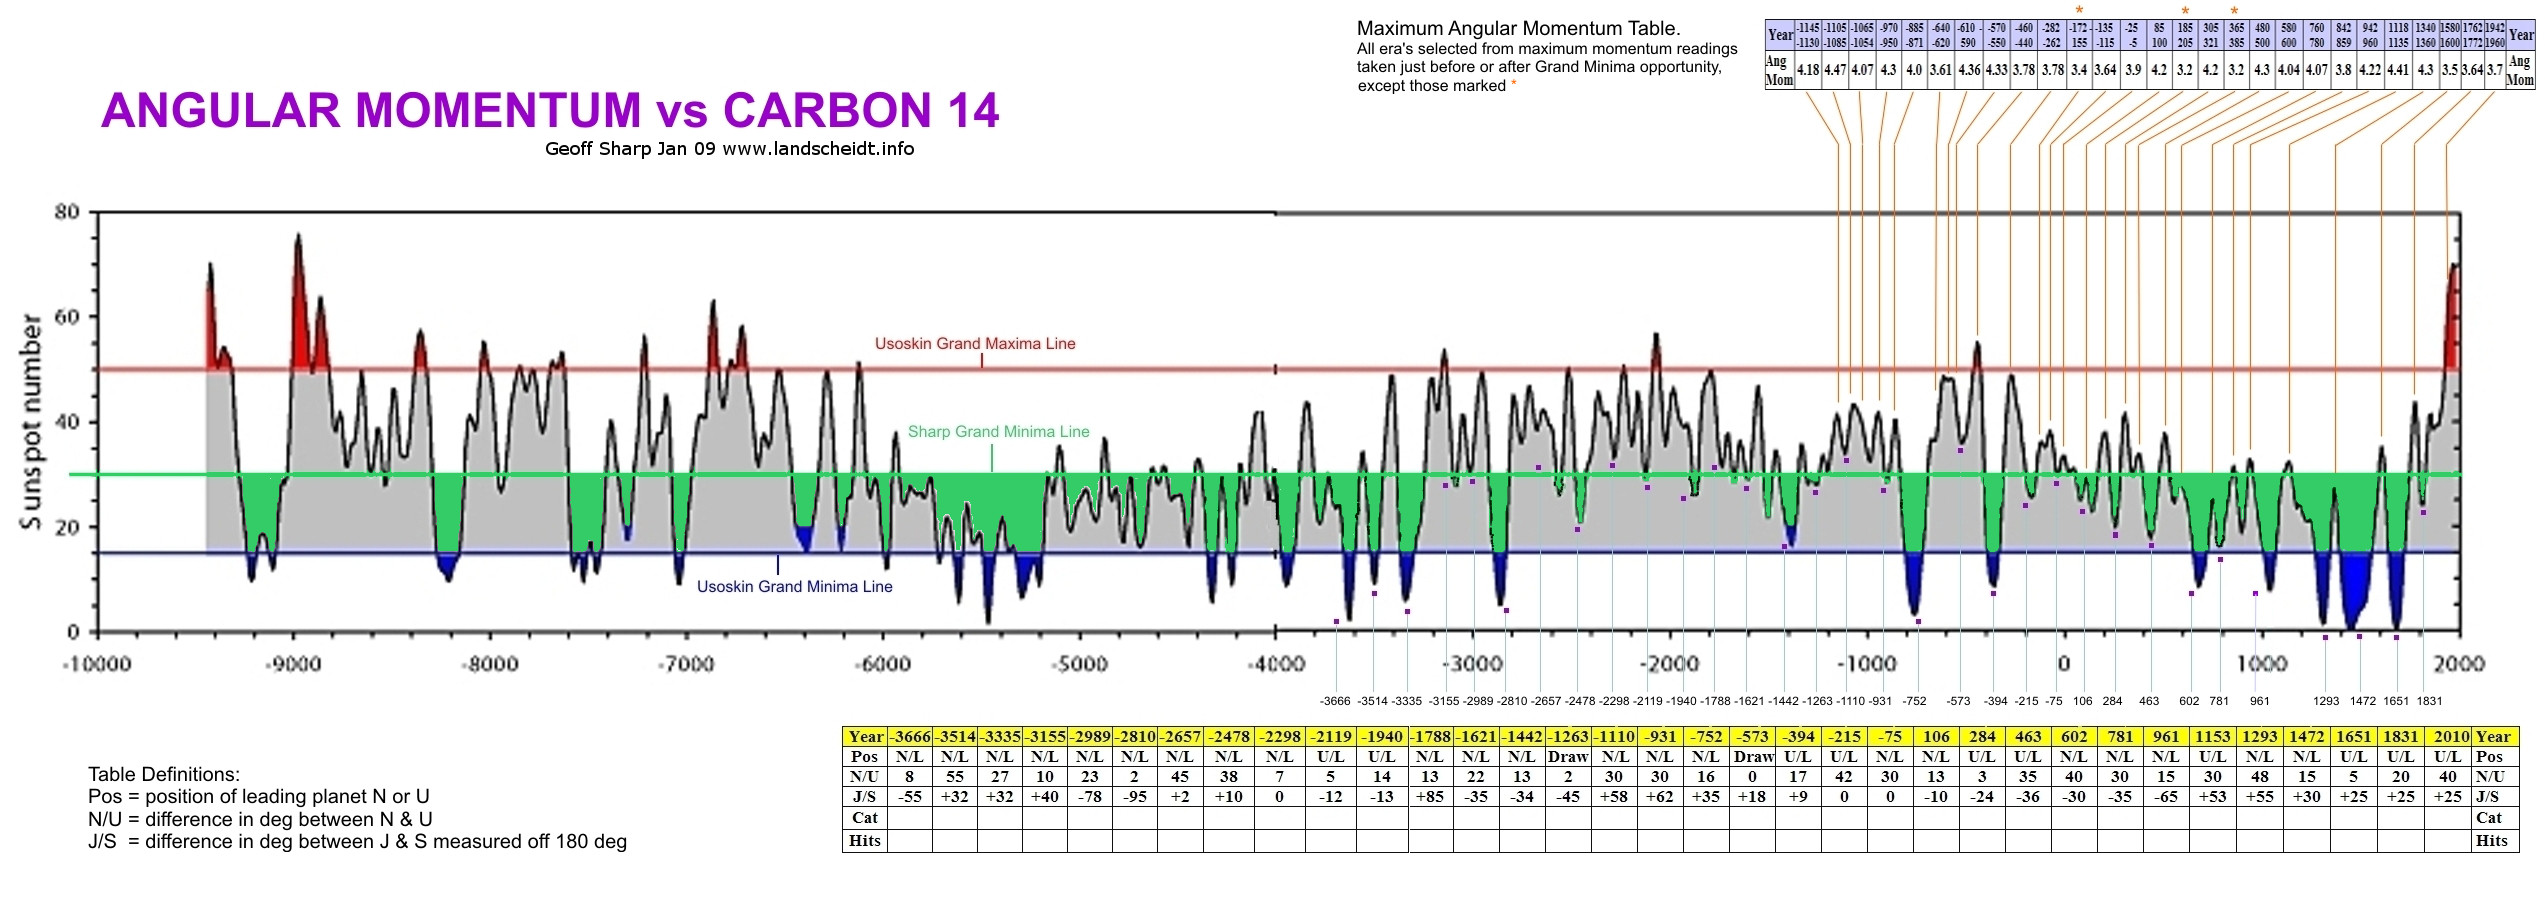
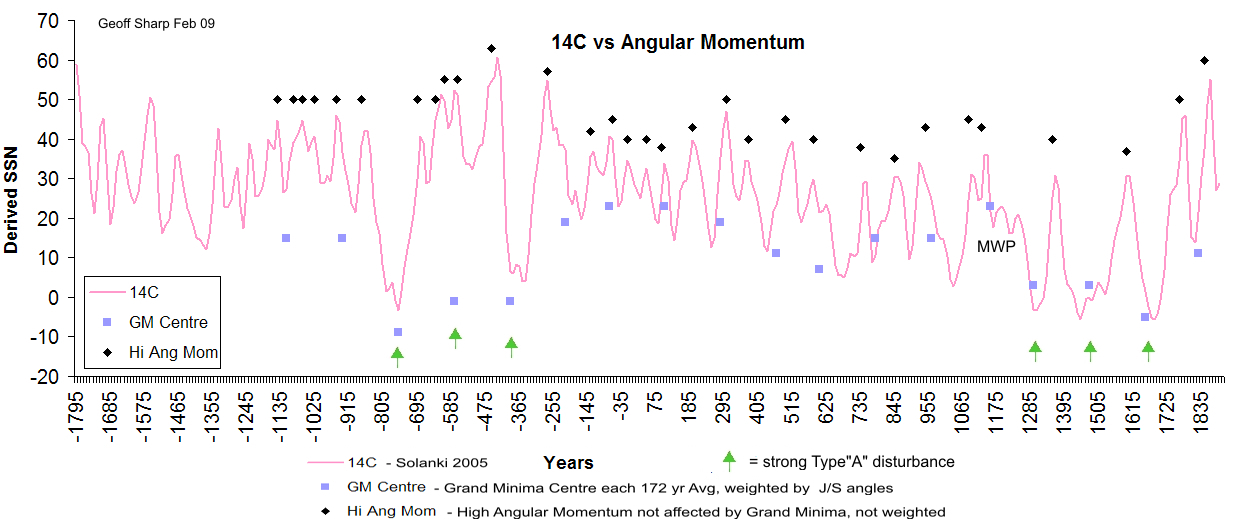
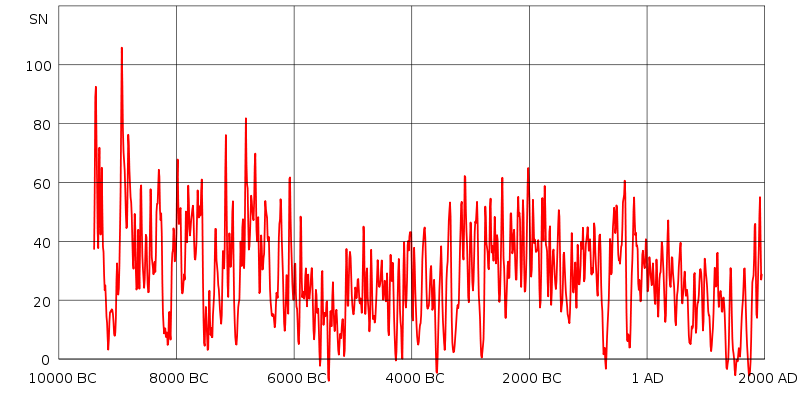
Graph 1. shows how the power of Angular Momentum matches up with the movement in the 11000 year 14C graph. Each high point on the 14C graph lines up with the regular high points on the Angular Momentum charts. Even more importantly, each Grand Minimum also lines up with the Grand minima type disturbances on the Angular Momentum charts. Strong Angular Momentum gives us strong Grand minima and also the high peaks on the 14C graph. Weak Angular Momentum gives us weak results, and lots of shades of gray in between.
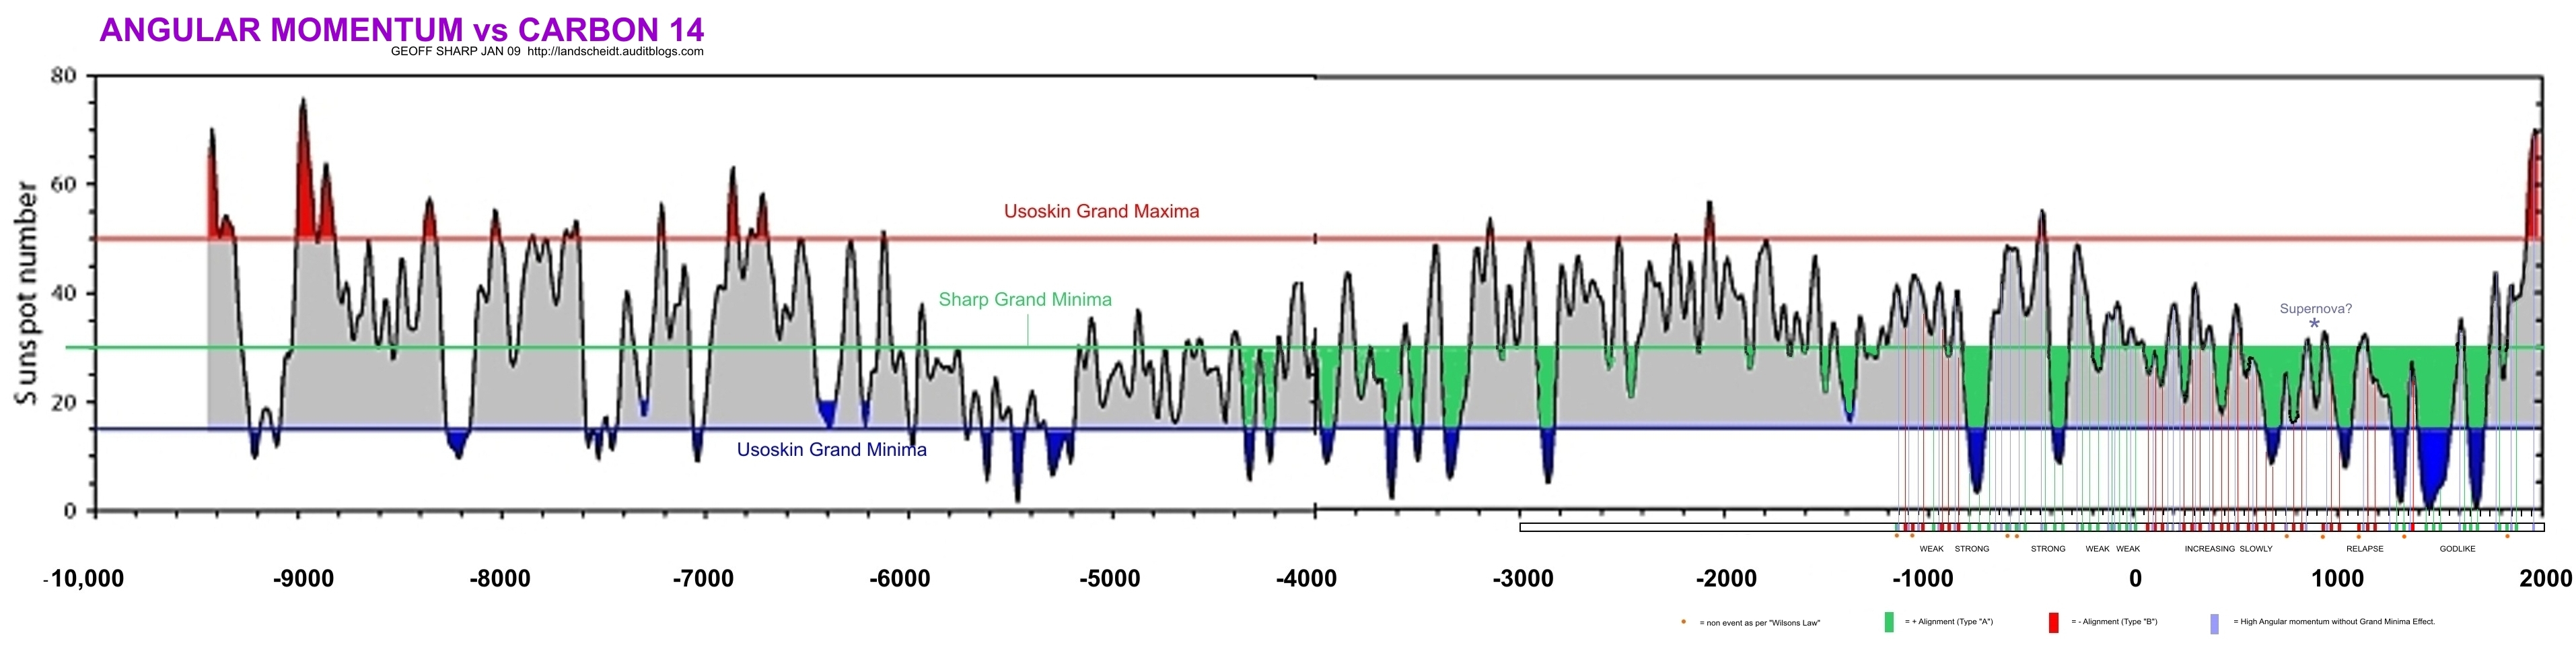
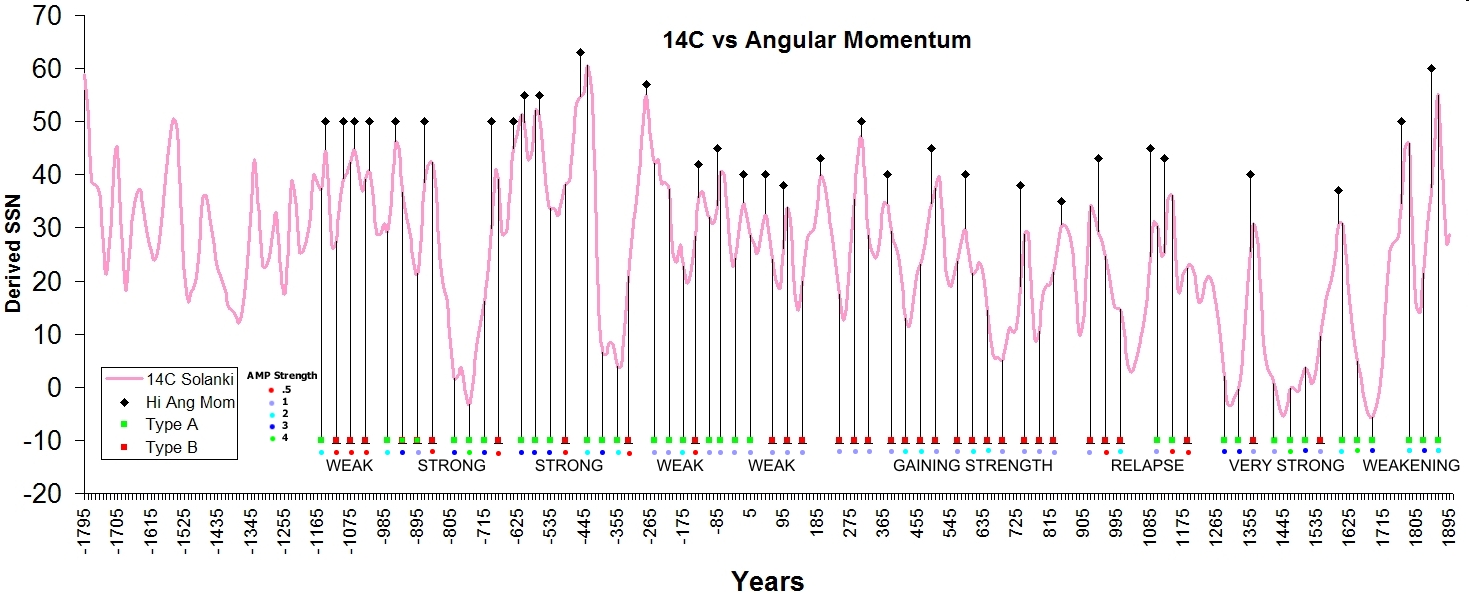
Graph 2.This graph shows all the angular momentum disturbances taken straight off the angular momentum charts showing each individual Type "A" & "B" disturbance as well as each non Grand Minima angular momentum high, each green or red square corresponds with grand minima type angular momentum that comes along roughly every 172 years, these disturbances line up with almost all downward trends.. Its a wave of power over the centuries, with very strong correlations on each peak and trough and shows how the changing angles distribute the phases of type "A" & "B" disturbance. Type "B" normally produce weaker Grand Minima, but also spread out the available opportunities (more than 3 red or green squares) each 172 yrs avg. Other observations show during times of weak angles the Sun is able to recover quickly from the slowdown and doesn't look to remain in Grand Minima mode for several sunspot cycles as we observe recently. Remember as in 1790, Grand Minima can occur on the disturbance or just after. I recommend saving this file and enlarging to see the full detail.
Graph 3. Excel spreadsheet graph using original Solanki data. Outstanding correlation of deep grand minima and high strength Type"A" angular disturbance signified by green arrows. -585 event not complying with "Wilsons Law" on first 2 occasions. (see below) Spreadsheet available at http://www.landscheidt.info/images/solanki_sharp.xls .UPDATE 11/03/09: Dr. Svalgaard could not find fault with the original JPL data (angular momentum) and the Solanki 14C data, along with my placement of that data.
Graph4. Showing each individual angular momentum disturbance (green/red) and how they sculpt the 14C silhouette. Now that I have the actual figures there is some subtle difference from my original graph. A very common occurrence over the centuries is Solar activity peaks happening just after angular momentum peak and DURING a period of angular momentum disturbance just like we had at the start of the Dalton around 1790. It may be a matter of timing, determining whether grand minima starts on the disturbance or the cycle after? Its obvious the Sun is agitated on a regular basis in the past, because the Dalton finished early and we missed grand minimum at SC20, we have experienced a prolonged era of solar activity in recent times.
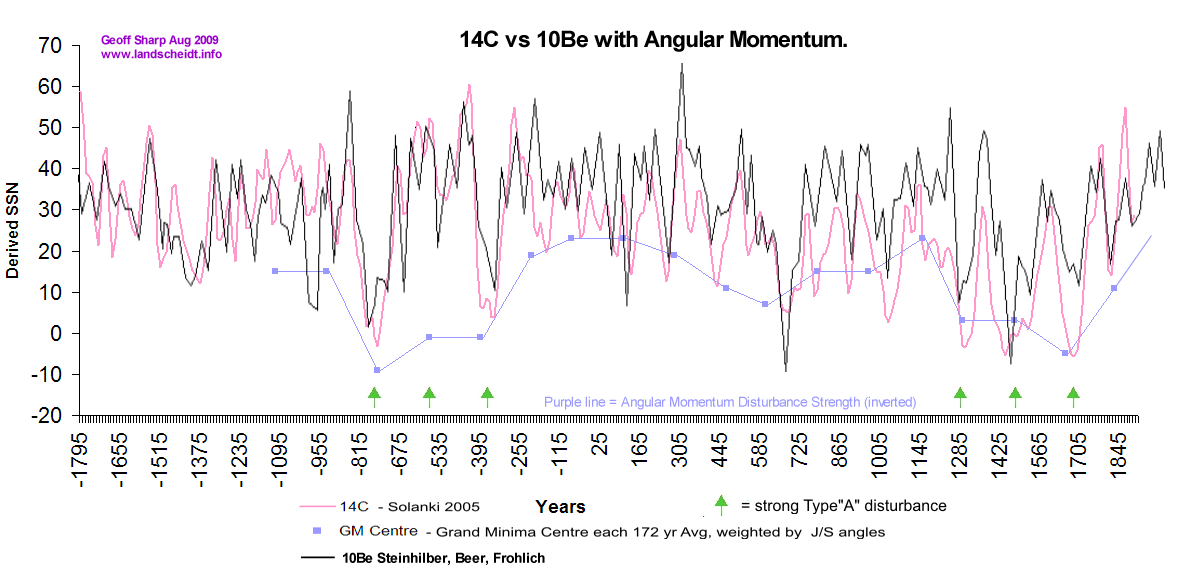
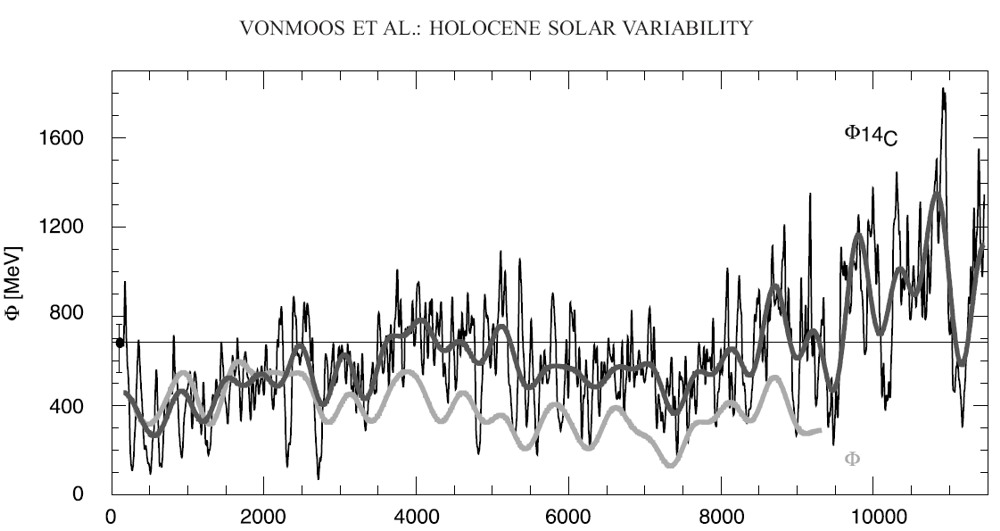
Graph5. New compilation of Solar Proxy records showing a very good match between 14C & 10Be. Angular Momentum Disturbance Strength curve in purple showing another very good match. The Holocene Solar activity and Temperature a direct result of Angular Momentum?
Does Angular Momentum drive the 11000 year 14C (carbon 14) graph which is backed up by the 10Be graph (Beryllium-10), my evidence strongly suggests so. If a theory on what controls the output of the Sun doesn't show a very strong correlation with the 11000 year 14C graph it cant be taken seriously, it is the best record of solar activity we have before the 1700's. I have looked at that 14C curve and wondered whats behind it for months, and now I believe we have the driver. Basically these 2 isotopes are used as proxy records to measure the output of the Sun over 1000's of years, and before 1700, is the only source of data to record solar activity. 14C & 10Be are laid down in ice core and tree data and both follow the same trend. Usoskin and Solanki et al has provided in a recent paper HERE, a graph that displays past grand minima based on 14C records (kindly alerted to me by Dr. Svalgaard). But I believe Usoskin set the bar way too low, ignoring events such as the Dalton minimum (Usoskin determines grand minima is >15 SSN). Although I don't agree with Usoskin's methodology or outcomes, I do thank him and Solanki for providing the graph. Note: If you havent read my basic theory on grand minima here is the link which will put things in perspective. http://www.landscheidt.info/?q=node/5/
The original Usoskin graph did not have the green line or green filled areas, but suggested Grand Minima only occurred under the blue line, the area above the red line is considered grand maxima by Usoskin. I have re-jigged Usoskin's graph by adding the green line to keep "Dalton like" events in the picture, raised the bar if you like, to leave out smaller grand minima doesnt make a lot of sense to me. I also tracked back independently grand minima events on a 172 avg year basis (Jose was not quite right) recording the angles of the Jovian planets which determines the strength of the grand minima involved (I chose the best N+U+J & S opposed lineup of that period, which is a window that comes along every 172 avg years, and most are the centre part of that period), this suggests we DO have a 172 avg year recurring Grand Minima event that have different levels of impact depending on their angular momentum at the time. This is a major break though, opponents of the theory have long suggested Usoskin's graph disproves the planetary influence theory, how wrong they have been. I am also recording the grand maxima peaks and noticing a sublime correlation. Every major spike and trough in the planetary record correlates with the 14C records, including the modulation. Higher angular momentum corresponds with deeper troughs and higher peaks as cross checked by the angular momentum charts and thorough examination of the solar system positions at each point. Another spin off of this study is, so far the planetary positions are substantiating the accuracy of the 14C & 10Be record chronologically, at least up to -3666 Note: see update that shows a possible dating error in the solar proxy records. The oldest 2000 years of the 14C record are taken from coral deposits, it will be interesting to see how that part of the record stacks up against the planetary positions. The high peaks are grand maxima if you want to call it that and are basically SC18 & 19 happening before every grand minimum. These high angular momentum periods are from 1 or 2 planetary alignments that occur just before grand minima as the angular momentum builds every 172 avg yrs. There is an extremely strong correlation in cycle peaks and high points in angular momentum, and 1 alignment in particular is showing up. Note: As observed in past strong Grand Minima, solar cycles directly after the initial slowdown are shown to exhibit a very low output, thus there is no high angular momentum peaks during this time.
Observations suggest a Jupiter/Saturn angle of around +30 deg produces the deepest and most prolonged grand minima if the Neptune/Uranus angle is low (smaller gap between them), like the Sporer Minimum pattern below. Other variations can exist to produce a strong grand minimum but are rare. The Jupiter/Saturn angle when Neptune and Uranus come together is the key to the fluctuations in the 11000 year record and is anything but random as some suggest. In particular the warmer/active periods are dominated by very low or neg J/S angles. The J/S angle sets up the grand minima & maxima phase and governs how many "hits" a grand minima gets, which affects the duration and depth. This can include up to 6 hits using double combination's of type A & B angular momentum disturbance. And all this and more is a simple creation of the probable infinite combination's of angular momentum strength created by the angles of Jupiter & Saturn.
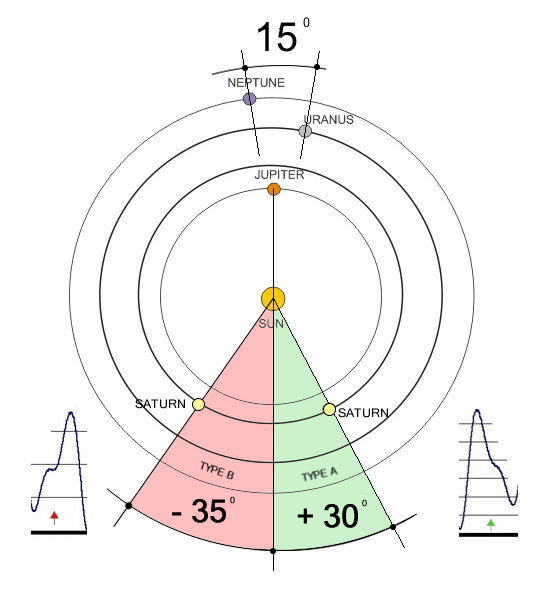 These are the 2 configurations ( angles vary slightly each time) that correlate on every occasion of Grand Minima for at least the last 6000 years. Type "A" is typically stronger than "B", but when they double team as they did during the Wolf Minimum and others, it delivers a deep knock out blow for many years. Jupiter and Saturn provide the bulk of angular momentum to our Sun, but every 172 years on avg, Neptune and Uranus join forces and completely change the picture. Note: If we look at the path of the Sun as it moves around the centre of the solar system, there is 2 distinct patterns. A long gradual sweep away from the centre of the solar system, followed by a tight circular pattern close to the centre of the solar system, this is Jupiter and Saturn providing the bulk of angular momentum . Type "A'' disturbances always affect the inner tight circular pattern, as shown later in this article.
The period between 0AD and 1200AD stands out, around the birth of Christ we have very weak J/S angles slowly increasing in strength as we move towards 900AD and the grand minima naturally follow the same trend. The J/S angles go from high positive to high neg between 961 and 1153 which leads us back into more type "B" territory. There is a trend in the J/S angles that follows the overall trend on the 14C chart. As we track back from 2010 we have good positive angles creating a golden era of grand minima, followed by a transition at the MWP then a run of not so good negative angles with poor minima right up to -394, where it returns positive for 4 cycles creating 2 big grand minima and then returning neg and backing off again etc. etc. With 3200 years plotted, only 2 areas raise some questions, around 600BC we see strong Type "A" disturbance not causing Grand Minima, most likely not following "Wilson's Law" (J/S conjunction occurring before solar cycle max). This unleashes high momentum peaks that would otherwise be quashed by Grand Minima which corresponds with a high flat peak in the 14C graph. This is not seen at any other period on the 11000 year graph. Around 900AD there is a Grand Mimimum type trough with no corresponding angular momentum disturbance ( the only one). Korte & Constable [2008] who are a major component of Usoskin's reconstruction of the 14C graph highlight 900AD as an era of possible error, and the 10Be graph does not show the same trend. This era was known for the settlement of Greenland incl vineyards etc suggesting higher temperatures, more research in this area is required. During times like around 1000BC the angular momentum graph dramatically changes, with lots of weak disturbances spread across like a saw blade, making almost a continuous period of disturbance, but not enough to cause deep grand minima, but enough to make the saw tooth in the 14C graph....there is so many chances for small maybe single or double hit grand minima, but Type "B" disturbance is affecting a different path of the Sun compared to Type "A" and may be much less likely to cause solar slowdown for more than 1 solar cycle. Another area on its own to research. I think these occurrences are true Grand Maxima as they run for extended periods of time without deep grand minima.
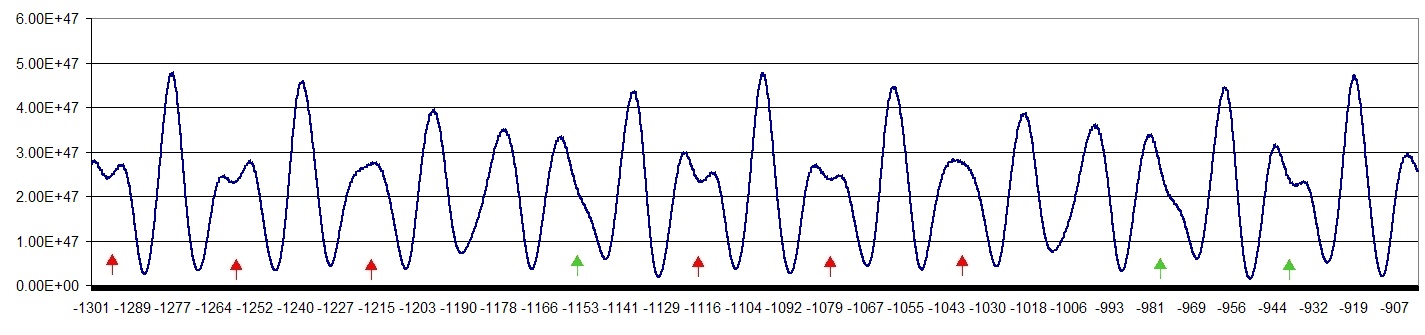
SSB graph for -1300 to -900. click on the graph for larger view. Notice the multiple mostly weak disturbances mainly controlled by type "B" (red arrow) configurations, this is like no other period I have seen so far, the J/S angles creating far extended disturbances over 400 years, very different from recent patterns...this is real Grand Maxima, similar but stronger than the MWP
Jose calculated a 178.8 yr period, but going back through time I found the Jovian planets through changing positions altered that period. I have plotted 34 grand minima from 2010 to -3666 giving a total range of 5676 divided by 33 gaps = 172 years. But the Gaps can get down as low as 140 depending on alignments but the same basic grand minima pattern of N+U+J & S opposing is still in play, except sometimes its stronger early, other times late. The next step is to measure longitude of J+S compared to N+U at each conjunction of N+U, this might give a more accurate measure of the 172 yr period strength and eliminate 2 of the the previous variables.
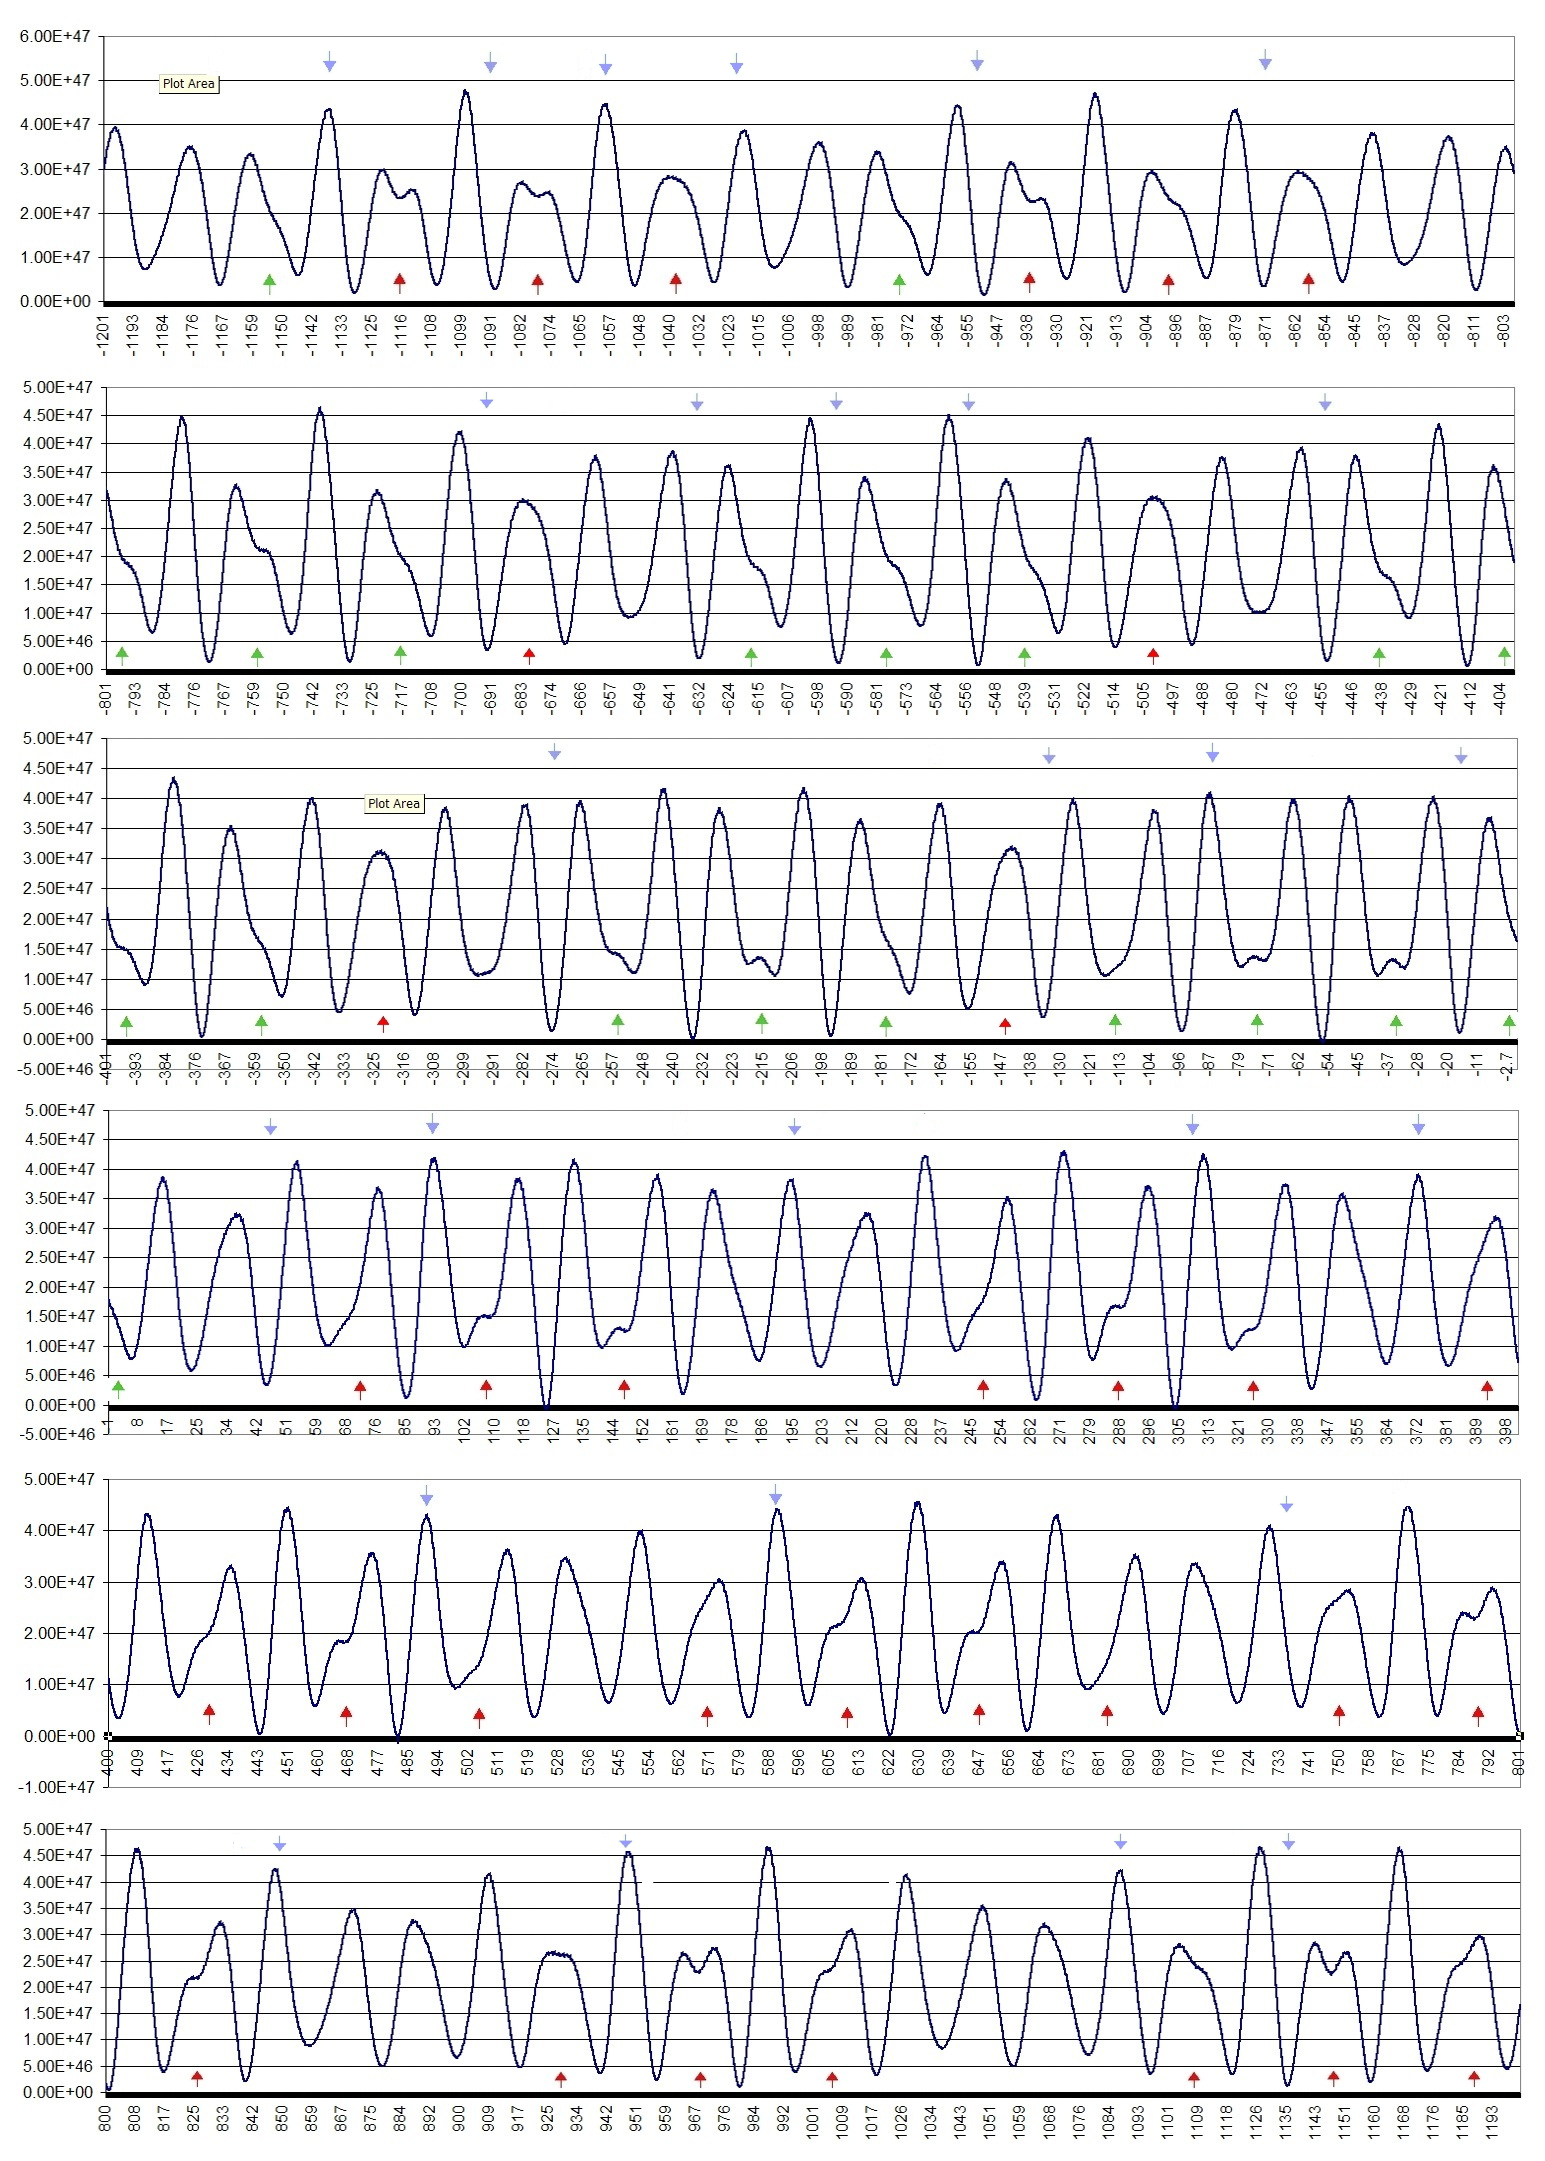
-1200 to +1200 Angular Momentum graph Click on the graph for a full size view and then magnify. Angular momentum graph from -1200 to 1200 showing all Grand Minima opportunities (red & green arrows) and non Grand Minima affected high points (purple arrows) as shown on Graph 2 at top of article.
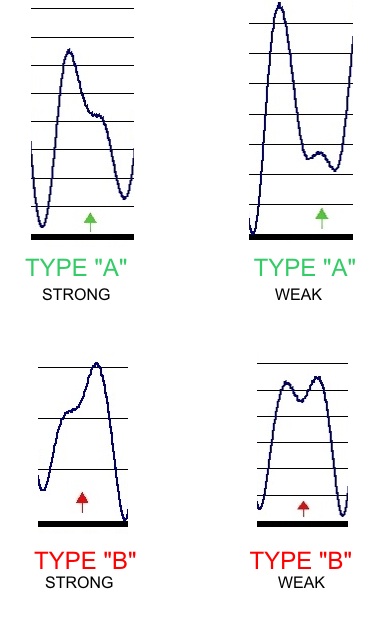 In the angular momentum graph illustrated above (-1200 to +1200 Angular Momentum graph), you will note the "camel hump" shapes (highlighted by the green and red arrows), which indicate angular momentum disturbances that differ greatly from the normal pattern. These are Grand Minima opportunities. Different versions of Type "A" & "B" disturbance that come along usually in groups of 3 every 172 years on avg, showing both strong and weak patterns. Type "A strong" is characterized by the "camels hump" showing midway through the cycle running towards J+S opposing (+25 to +60 deg). Type "A weak" is characterized by a small hump at the end of J+S opposing, caused by a very low J/S angle. Type "B strong" is as per Type"A strong" but is associated with a negative angle (-30 to -95deg). Type "B weak" shows J+S together with N+U dragging the height of the peak down considerably. Type "A" disturbances are generally far stronger (Grand Minima producing) than Type "B". In a nutshell these configurations control the shape of the 14C curve with the most deep Grand Minima occurring around the times of strong Type "A" configurations. The strength of the disturbance and the shape of the "hump" is completely dependent on the J/S angle at the time. Each 172 years their angles changes slightly as the planets progress their allotted path.
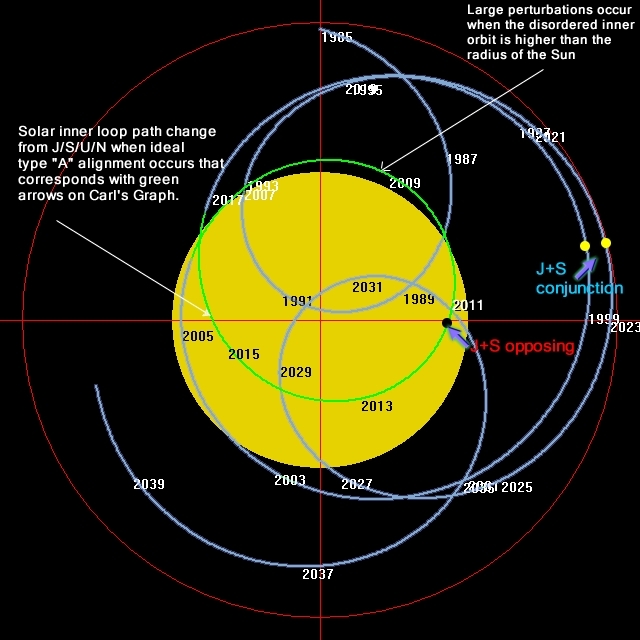
The path of the Sun is altered by the extra momentum created by N+U. Here we can see the Sun entering the "chaotic" phase exactly at the same time as the disturbance on Carl's SSB graph, which shows a reasonably strong Type "A". There are predominately 2 path cycles, A larger outer cycle followed by a tighter inner cycle with each extremity of the cycle lining up with high and low points on the Angular Momentum graph, each taking roughly 10 years. A Type "A" disturbance affecting the inner cycle (making larger) first half of the inner loop and a Type "B" affecting the outer cycle ( creating a more shallow curve) last half of the inner loop. The timing of the disturbance relative to the position of J+S being the key to Grand Minima strength. Note: The positions of Jupiter & Saturn as marked are representative of the average position across all inner and outer loops. During the close alignment (conjunction)of Uranus & Neptune this position can change by 6-12 months.
Thanks to Carsten for the software to create the above image. http://www.arnholm.org/astro/index.htm
Click on this link to watch a movie of the above. http://www.landscheidt.info/images/sim.swf
There have been a number of studies using mathematical models to predict solar cycles incl: Sonett [1982], Damon and Jirikowic [1992], Vasillev and Dergachev [2002]and Clilverd et al [2005]. Clilverd's work with repeating patterns has hit on the background repeating solar trend and predicts very similar outcomes to what we see from the angular momentum charts. Science has noticed the pattern but until now did not know what caused it. An interesting piece from Clilverd et al " From long-term data such as the C14 series it is clear that low-frequency cyclic oscillations caused by solar activity are present [Stuiver and Quay, 1980; Neftel et al.,1981; Solanki et al., 2000; Beer, 2000]" The Clilverd paper can be found here: http://users.telenet.be/j.janssens/SC24Clilverd.pdf Jose is indeed the biggest contributor in the Planetary Influence field, and in my opinion deserves the naming rights for the next grand minimum. Others have followed on from his lead which started in 1965 including Fairbridge, Wood, Shirley, Landscheidt, Blizard, Sperber, Gokhale, Javaraiah, Charvàtovà, Zaqarashvili, Freeman, Hasling, Juckett, & Wilson, but perhaps they all missed the vital controlling factor, Neptune & Uranus. On the surface that sounds unbelievable and even I find it amazing planets that far away can have any influence, but I think we are all going to find out they indeed do. Feel free to ask any questions, I encourage vigorous debate. Here is some more 14C and 10Be data.
Stretch the data out a little and it all becomes clear...
14C and 10Be combined to show almost exact match, 14C black, 10Be gray..this graph is reversed and needs to be mirrored to align with previous graphs
Carl's original graph was the seed for this project.
Geoff Sharp.