Solar system dynamics are interwoven into all aspects of life as we know it. Gravity being the ultimate blacksmith that shapes our destiny. The very driver of the Sun's Dynamo and Earth's climate are harmonic resonances between the larger bodies in our solar system, which also mesh with magnetic/electrical forces.
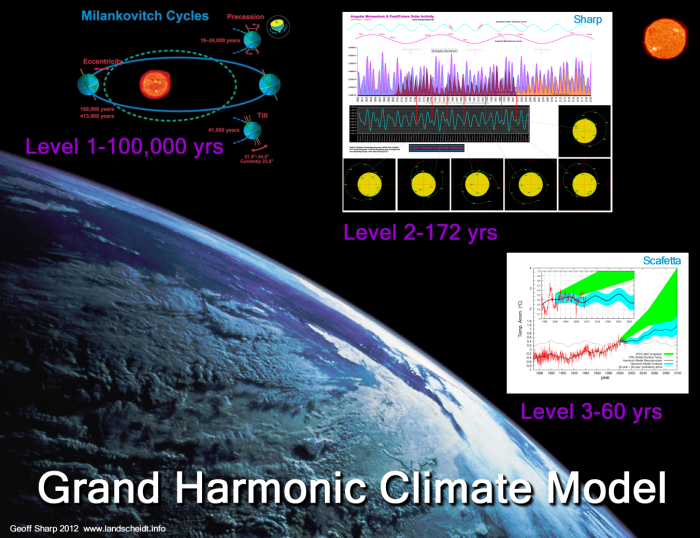
These harmonic drivers can be broken down to three levels.
1. The Ice Age Cycles (Milankovitch, 100,000 years)(J/S/U/N)
2. Solar Grand Minimum & Solar Modulation Cycle (Sharp, 172 years)(J/S/U/N)
3. PDO/ENSO Harmonic Cycle (Scafetta, 60 years)(J/S)
This article will deal with the brief concepts behind each of the 3 levels along with interaction of each level with our atmosphere and, how each player is inextricably linked with all layers of the atmosphere that work together to form a complex organic total system.
Level 1 was first proposed by Milutin Milankovitch during the years of the first world war. Planetary gravity forces from the outer 4 planets over 100,000 years gradually change the shape of Earth's orbit from circular, to elliptical along with shorter term changes in the inclination angle and winter precession timing. When a particular combination of the orbital elements is reached, high latitudes of the northern hemisphere begin to experience year round snow. This triggers year on year ice growth because of albedo changes, that now reflect solar energy away from Earth. The Earth spends 90% of its time in frozen conditions, with the recent warm Holocene period (11,500 yrs) drawing to an end. Ice Age cycles once invoked, over ride the smaller influences of level 2 and 3.
During the warmer Holocene type periods level 2 & 3 harmonic cycles rule the day.
Level 2 was outlined in rough terms by pioneers such as Jose, Landscheidt and Charvàtovà who each identified crucial components, which where brought together and quantified with the assistance of Carl Smiths solar angular momentum graph. The new information led to discoveries which enabled quantification of the precise timing and strength of past and future solar grand minima, along with the discovery of the 172 year solar powerwave. This wave controls the overall solar cycle modulation. Many references can be found on this site on level 2 theory, along with a published paper found HERE. A recent paper by Wolff and Patrone (2010) has provided a physical mechanism for angular momentum theory. In summary level 2 forces shape the Holocene solar output and Earth temperature overall trends.
Level 3 is a well known 60 year cycle in Earth's temperature record that in recent times aligns with the PDO/ENSO record. Nicola Scafetta has documented in several papers how the temperature record coincides with two solar system harmonic patterns. The solar velocity 60 year cycle and the Jupiter/Saturn synodic harmonic cycle along with Lunar harmonics being the thrust of his proposals. Level 3 influences can be strong, and potentially over ride level 2 when the 2nd level is not in a deep low stage. Level 2 is always present, but having different influences depending on timing. The 60 year cycle in Earth's temperature is most likely controlled by the PDO index which over the last 100 years aligns with global temperature. The PDO index is often portrayed by the warmist crowd as an "after effect of ENSO" in some attempt to diminish the crucial role the PDO plays in climate fluctuation, preferring us to believe CO2 is the main driver. In 2011 we saw clear evidence of the warm pool in the Pacific northwest (which is the main characteristic of the cool PDO phase) IS capable of "charging" the Walker Circulation pump that drives La Nina and inhibits El Nino. The neg PDO warm pool was responsible for the last stage of the back to back La Nina of 2010/11. The presence of the 30 year PDO warm pool will tend to favour La Nina over El Nino events which regulates Earth's climate.
Further research is required to determine the cause of the PDO, but I am backing Dr. Scafetta at this point.
Effects on Earth's Atmosphere.
Earth's atmosphere may be broken up into multiple layers but each layer is part of a functioning overall system. The troposphere where we live (0-10km) is very much interlinked with all the layers above. Each layer receives different influences from the energy sources available, but interrelate as a whole, to form weather patterns experienced on the surface. When it comes to level 2 energies, the most variable are solar UV outputs, which have large potential to alter climate cycles.
 Solar UV ranges from 10-400nm on the spectral scale and is broken up into 3 basic categories. EUV is at the extreme end of the spectrum (10-125.6nm) which includes the important Lyman alpha portion which resides at the high end of the EUV scale. EUV values vary by 30-100% across the range over the solar cycle, and have the most potential to modulate atmospheric chemistry, size and temperature. FUV (126-200nm) also shows big variations in the 10-30% range and is a very important player along with EUV for ozone formation in the stratosphere and mesosphere. MUV (200-300nm) is a solid ozone backstop but only varies 1% over the solar cycle but still relevant when comparing overall TSI (total solar irradiance) variance of 0.1%.
Those that subscribe to AGW science will only push TSI when it comes to solar influence on climate. The records gathered from somewhat dubious satellites during the space age display a small 0.1% change in solar HEAT output over a few solar cycles. To really appreciate the true solar effect on climate it is necessary to include chemical changes and total solar influenced cloud cover to see the real picture.
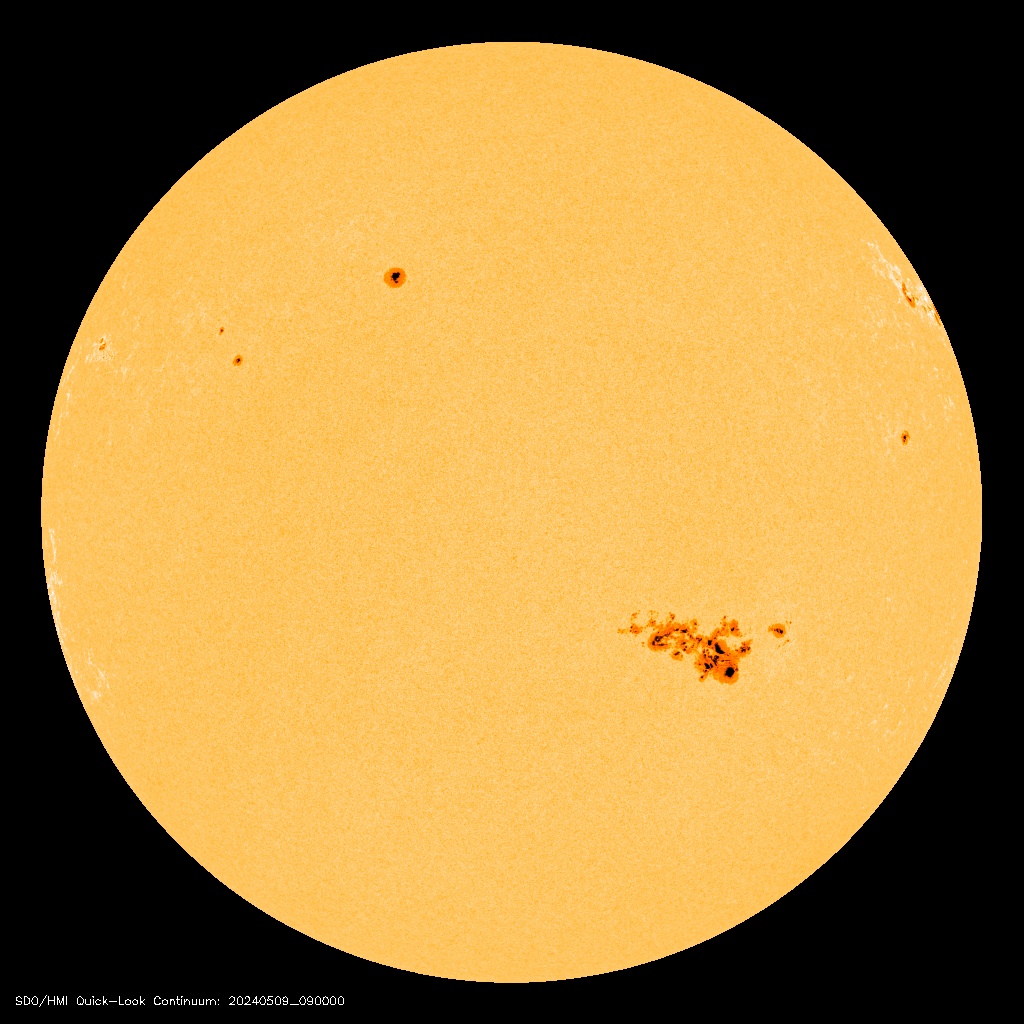
Beginning with the most variable component of solar output spectrum, EUV has only in the last few decades been studied in detail, and is now one of the areas where real dollars are spent in space exploration.
EUV is mainly consumed above 100km in the thermosphere where the air density is low. Some of the climate relevant reactions occur in this region producing atomic oxygen and nitric oxide that later play a large role in ozone formation/control at lower levels. In the EUV range there is an important lively band in the Lyman alpha range (125.6nm) that penetrates down to 70km. As seen in the above diagram different ranges of the UV spectrum are absorbed at different altitudes, the Lyman alpha range is particularly strong and produces large amounts of atomic oxygen down to 70km that is used in the formation of ozone in the mesosphere. Solomon (1982) and others show how this atomic oxygen is also pumped down to lower levels to further assist ozone production, the downward mechanism coming from eddy diffusion. EUV can produce species that build ozone but it can also produce large quantities of nitric oxide (NO), that destroys ozone. Nearly all NO is produced in the thermosphere, with the majority portion coming from EUV interaction. But, during times of high aurora activity a process called EPP (Energetic Particle Precipitation) can produce as much as 50% of the total NO production. Solar proton events and cosmic rays also play their part which all come under the general umbrella of solar modulation. Several authors including (Solomon, 1982) and a good overall reference HERE have shown that great quantities of NO are diffused down to the mesosphere and stratosphere where they have great influence in ozone formation (negative). The downward path coming from eddy diffusion and the downward flow to the northern polar vortex at the tale end of planetary and gravity waves. The ozone process is complex and little understood, but recent finds by Haigh are showing quantities of ozone can increase above 45km and decrease below during times of weak solar activity, which is no doubt brought about by the chemical changes that fluctuating EUV/FUV brings along.
 Baldwin et al who are considered the experts in the QBO (stratospheric wind oscillation) speculate on the role of UV in the mesosphere and how modulation could play an important role in the break up of the northern polar vortex. The break down of the vortex is a key component of the AO index which is hard linked to the behavior of the jet stream.
“Because of the strong absorption of ozone in the UV occurring in the upper stratosphere and meso-
sphere, a solar influence on the thermal structure in these regions of the atmosphere is plausible. This, in
turn, might affect the strength of the planetary wave driven “extratropical pump” [Holton et al., 1995]. A
mechanism involving downward propagation of stratospheric anomalies, through modification of planetary
wave propagation from below, is discussed in section 6.2.”
Further to Baldwin there is a very comprehensive paper by Hood that discusses all of the atmospheric topics mentioned in this article. Hood and his references show a very strong link between varying solar EUV/FUV and stratospheric influence on tropospheric climate.
The jet stream changes which drive cold air from the polar regions has provided colder conditions for the past 3 years, any changes to cloud cover extent which is also proposed by harmonic drivers will further increase the influence from exterior sources.
The links between solar activity and climate remain controversial, but headway is being made to oppose some of the accepted science in this area. Similarly the planetary links to solar and PDO drivers are also making headway as more research comes to hand. Nicola Scafetta has already proposed a Harmonic Climate Model which deals with the level 3 oscillations. Nicola is very aware of the higher levels that need to be fully incorporated, which perhaps may happen in print in the not too distant future.
UPDATE Feb 9 2012: Some thoughts on why there is an increase in ozone above 45km and a decrease below during low solar output.
There have been some interesting observations in the last 2-3 weeks. The QBO entered its easterly phase at higher altitudes, 1.5 hPa zonal winds decreased sharply, NH polar ozone levels around 45km increased while the same region saw a drop in temperature, the AO went negative with an abrupt change in jet stream behavior that Europe is now witnessing via some fairly brutal weather. I think a large factor of these occurrences is solar induced through variance in EUV and FUV, could the ozone movements be a symptom and driver of this observation. If the QBO is favorable, and the below 45km area low in ozone via low solar output, planetary waves are allowed to move lower ozone to higher levels (esp polar regions). The migrated ozone can exist longer above 45km because there is less UV and nitric oxide available during low solar output which would normally restrict ozone.
---------------------------------------------------------------------------------------------------------------------------------------------------------------------------
Below is a table displaying the metrics involved in the "Great Winter Freeze of 2012"
Click on the images for a full size view
| Great Winter Freeze of 2012 Metrics |
|
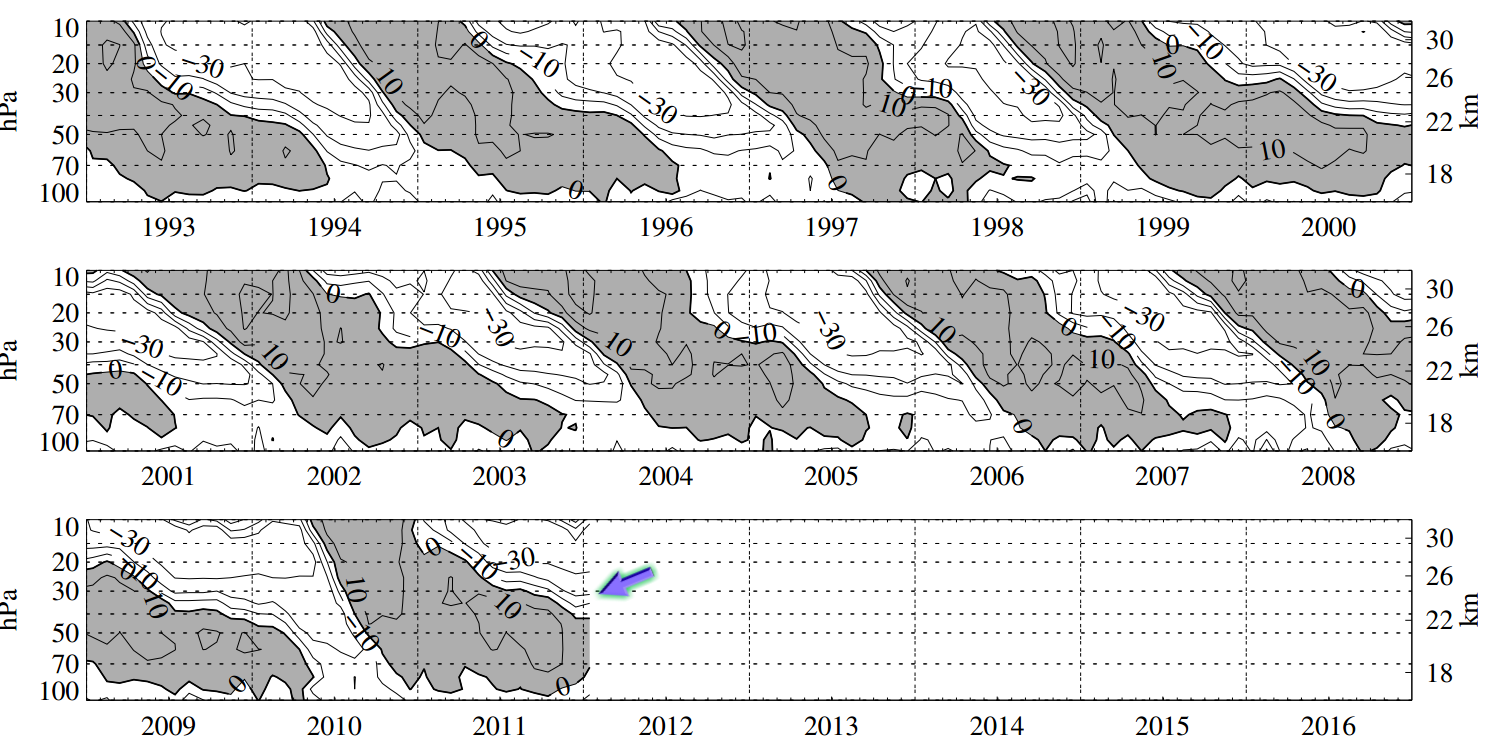 |
QBO diagram taken from the University of Berlin. The darker area is the westerly flow and the white area is the easterly flow. The break up of the northern polar vortex is the key to realizing a neg. AO. It is thought planetary waves traveling up from the equator to the pole is fundamental for this process. An easterly QBO encourages this process, which can be seen to be developing at higher altitudes. |
 |
Upper Stratospheric zonal winds show a sharp decline at the end of January. Baldwin et al and others suggest this is one factor required for the intrusion of the planetary wave to the polar regions. This metric showing the easterly phase of the QBO kicking in. Note: QBO easterlies are stronger during low solar output. |
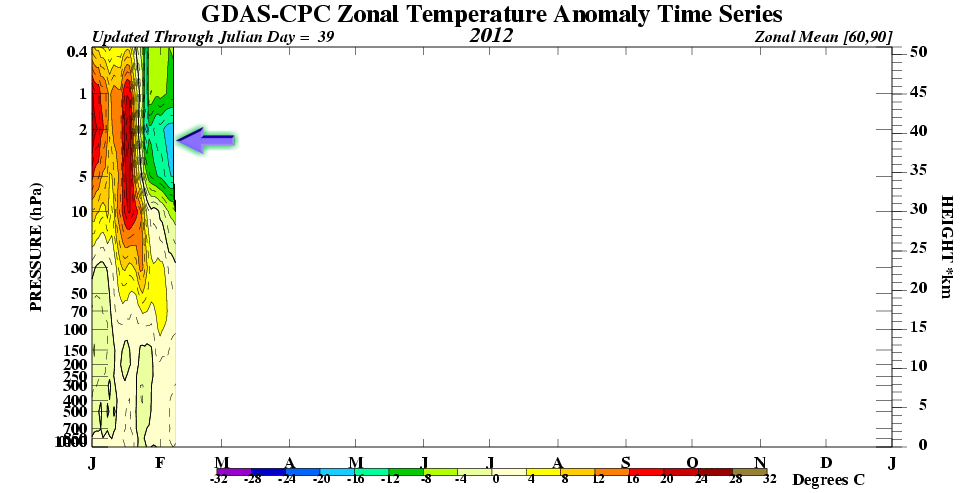 |
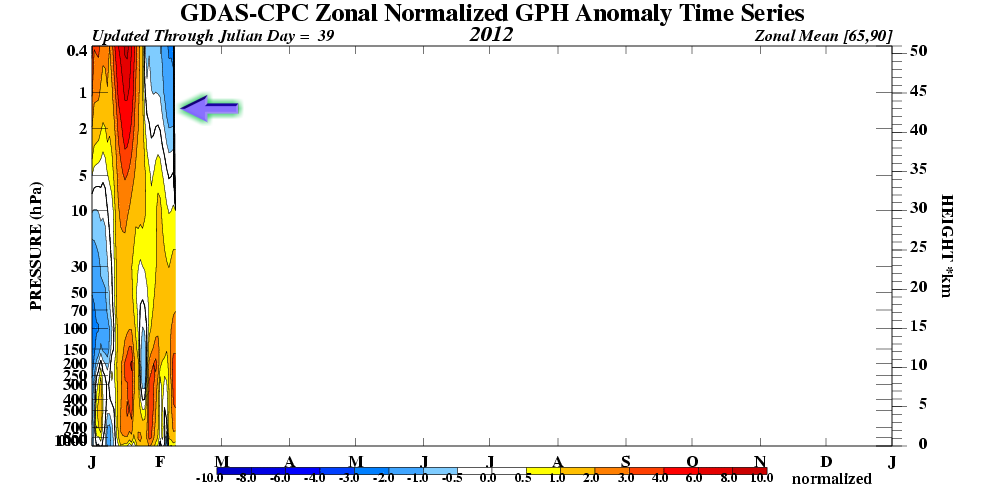
Upper Stratospheric temperatures have shown an overall cooling which is perhaps unexpected but when looking at the spatial patterns (next) there are also warm areas that are the signature of a collapsing polar vortex.
|
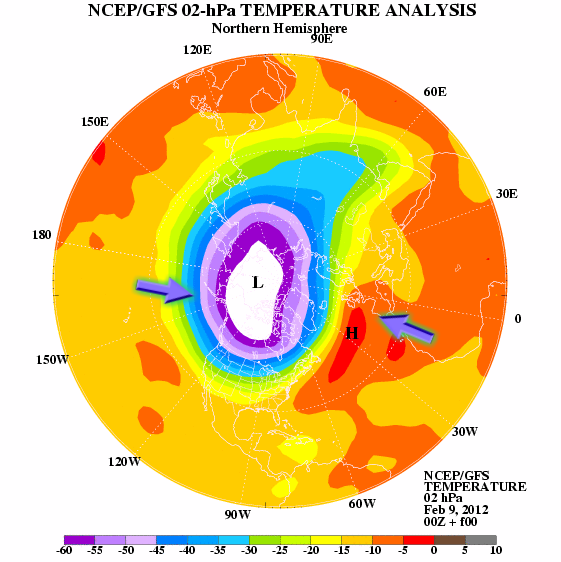 |
Upper Stratospheric temperatures shown in a different format show the distribution of temperature across the pole. Notice the warm area is over Europe. The temperature spatial patterns align with the ozone spatial zones.
|
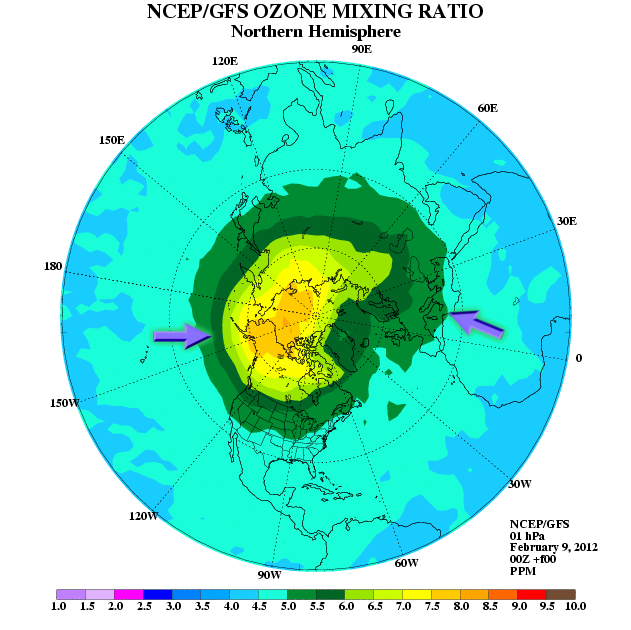 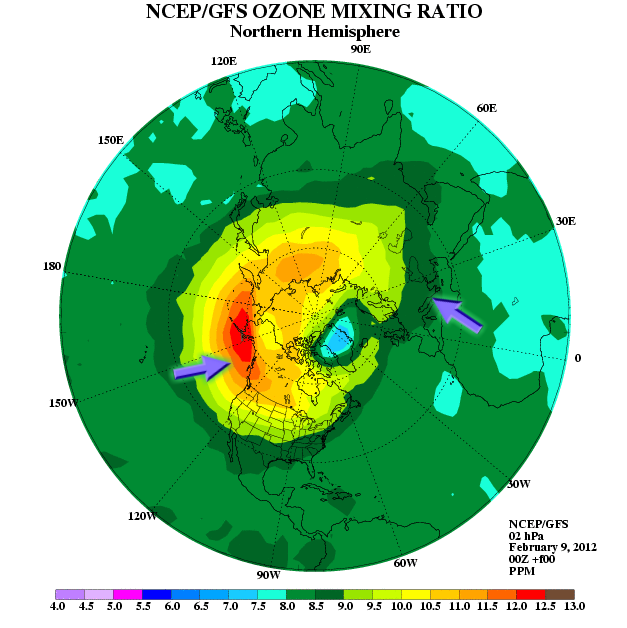 |
Upper Stratospheric polar ozone mixing ratio plots showing a distribution bias away from Europe. The higher ozone quantities are possibly from 2 sources. Low solar activity promotes less NOx activity which destroys ozone at higher levels, and ozone from lower levels is transported via the now productive planetary waves.
|
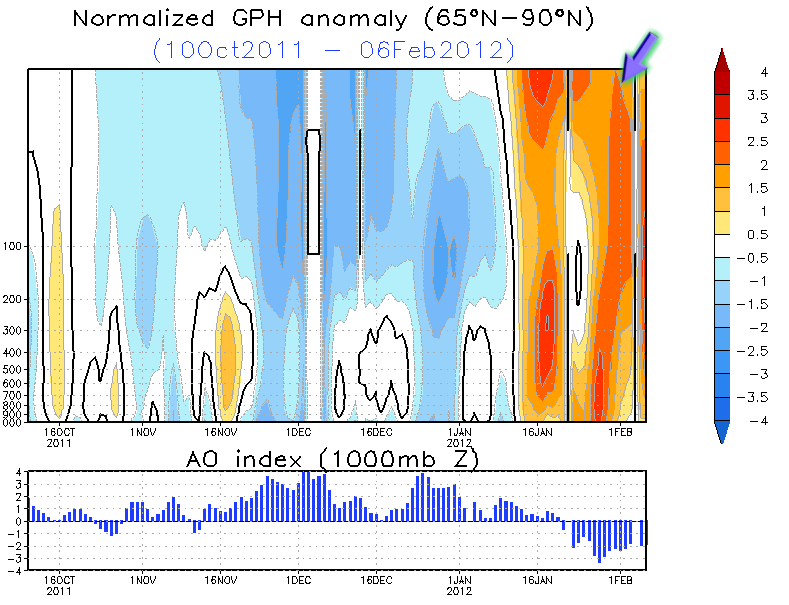 |
The all important northern hemisphere vortex graph along with the AO position showing the sudden weakening of the polar vortex (red) in January. Notice the slight lag in timing of the AO index. A negative AO changes pressure patterns at higher latitudes which influence the shape of the jet stream. |
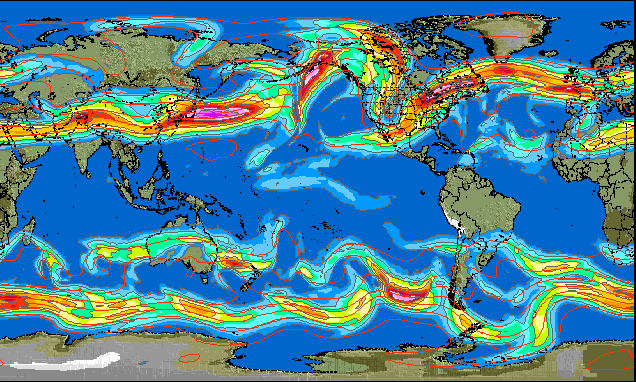
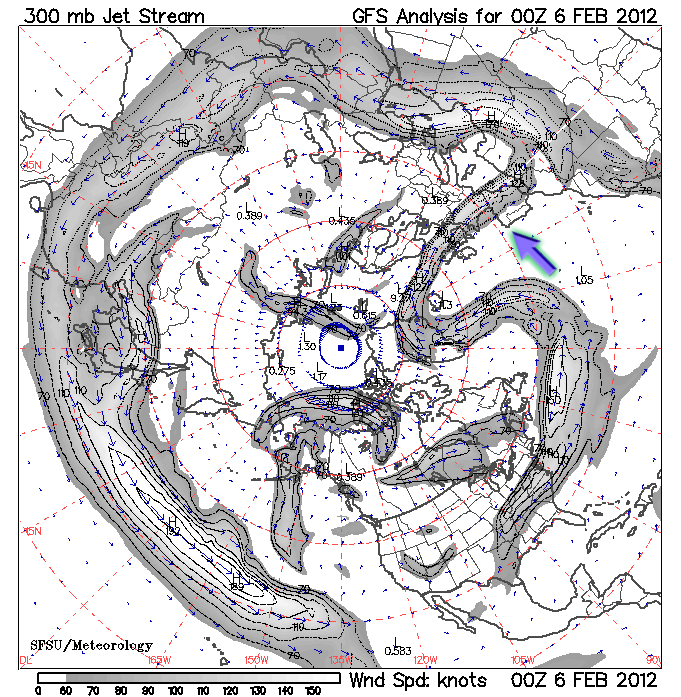 |
The end result felt at the surface. The negative AO changing the shape of the jet stream that now favors central and western Europe. Cold Arctic air is drawn down over Europe. Nearly all severe global weather events of the past few years are aligned with a jet stream climate forcing. The position of the AO and AAO in the south determining which part of the globe is affected. |