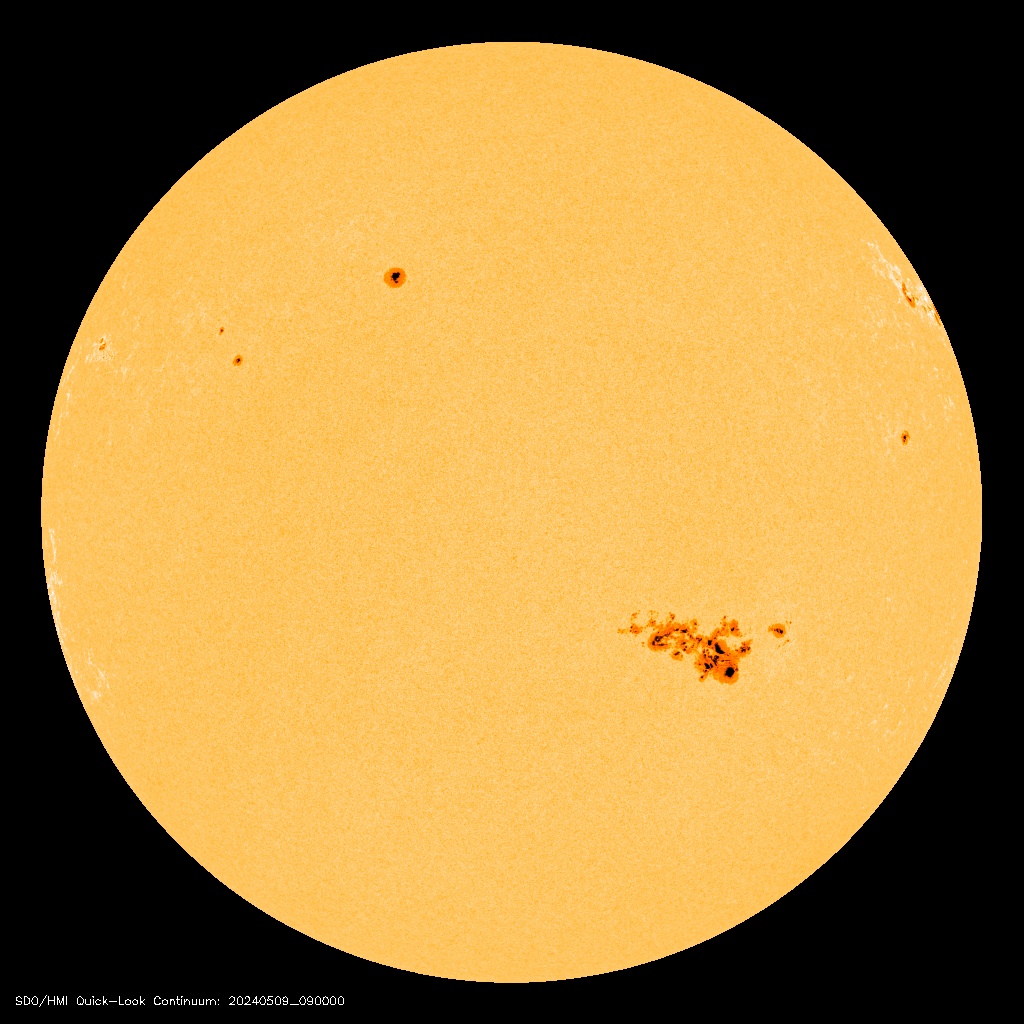
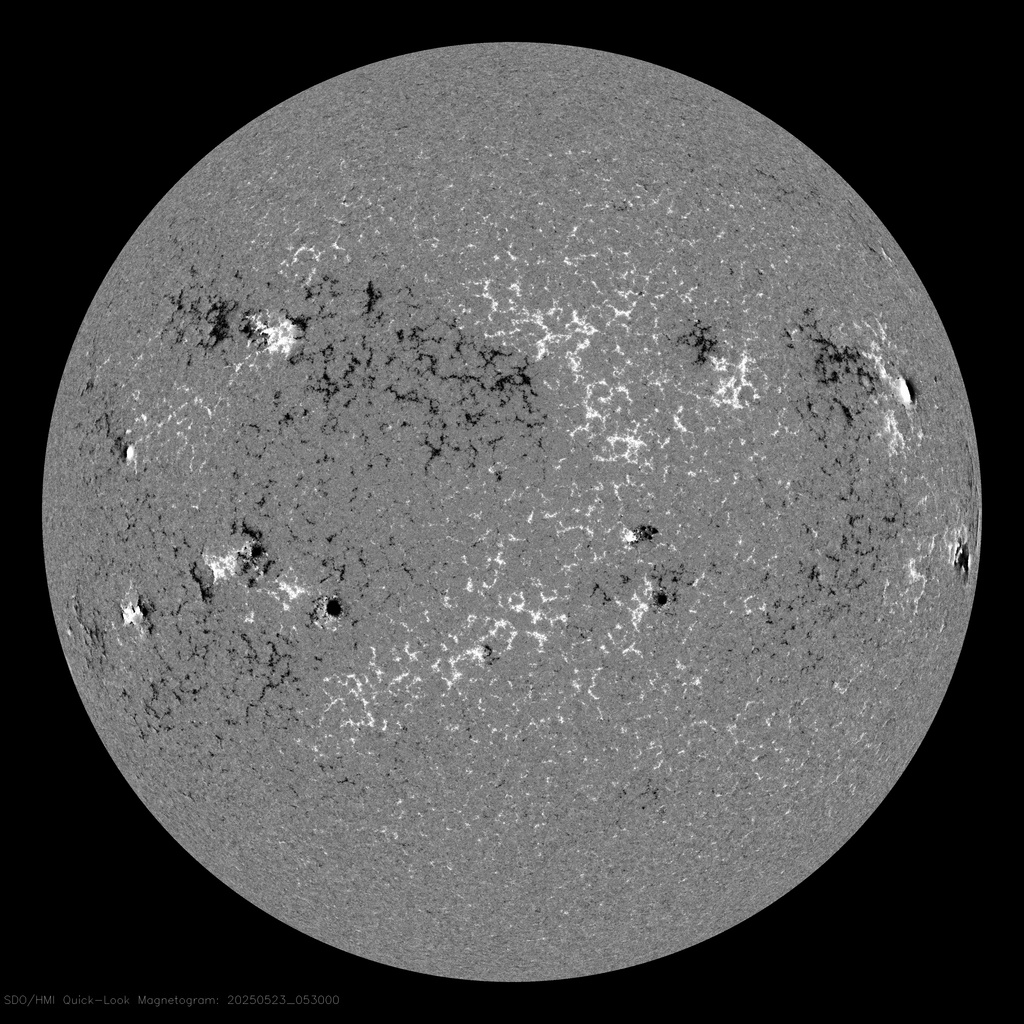
What modulates our Sun? The majority of science work on the principle that the Sun is self modulating and each solar cycle is a product of a random number generator. There are others that suspect the Sun is modulated by the planets with a special emphasis on Uranus & Neptune. Thanks to Carl Smith who has recently left us we have new knowledge that significantly adds to Jose, Landscheidt & Charvàtovà's work.
Geoff Sharp


Comments
Third Event
Just a minor point mentioned in the conclusion which I would just like clarifying: is it rare that we aren't experiencing a third event or is it rare for there to be a third event?
There seems to be
There seems to be another recent paper which suggests that the sun is headed for a Grand Minimum which is not going to be shorter than a century! Please tell me they're wrong! Here is the link:
http://journalofcosmology.com/ClimateChange111.html
rare event
Yes it does appear rare that we are not experiencing a 3rd AMP event this time around. It probably happens on a cycle as the position of the planets gradually change over the centuries. In recent times 3 events has been the norm but there are instances of 4 events that occur before the Sporer Minimum.
wrong
I do think they are wrong.
The paper is based on statistics and does not offer a reasonable argument in my opinion. It may take some time before we will know for sure unfortunately.
Solar Cycles and Planets
Are ALL solar cycles long AND short controlled by planetary movements or are there some which are internal to the sun, like the 11 year cycle?
11 year cycle
The 11 year cycle is an area where both sides of science really don't have a definitive answer. There has been some work done by Desmoulins and Hung that suggest the 11 year cycle is in sync with Jupiter, Earth & Venus orbit patterns (most aligned days)but the jury is still out. Doppler observations of the torsional oscillation patterns on the solar surface show recurring bands of fast and slow regions that start every 11 years and persist for around 17 years. The sunspot butterfly patterns align with these regions and look to be linked. If we can discover what drives these patterns which arise from the Tachocline a lot of questions will be answered.
I wrote an article on Carl's Blog some time ago that deals with torsional oscillation HERE
Sun spot cycles
Hi
In answer to the question does the planetary positions determine Sun spot production, the answer is yes it does. My father, Fred Bailey, set out about 7 years ago, to try and determine what causes Sun spots. Fred looked at all the available data and ideas but saw nothing that was convincing, although some, such as Landscheidt did go some way to linking various aspects related to this. To make the calculations easier (although it still resulted in years of work) Fred looked at Newtonian laws and could see no reason why this should not be sufficient for the task, he also realised that the only way for the solar system to remain stable and for Newtonian maths to work, then the ecliptic plane must be inclined at 45 degrees to and square across, the line of flight of the Solar System Centre of Mass (SSCM), it is also unnecessary to use all the planets as the minor planets make small differences to the calculations, so he plotted the positions of the four major planets, worked out their moments abouth the SSCM then resolved them into one phantom planet and plotted this path about the SSCM, therefore the path of the Sun about the SSCM is merely the mirror image of this, but of course to a smaller scale, to allow for the difference in mass. Fred then looked at the record of Sun spot production and started to look for patterns, he soon found all the major cycles e.g. the 179years, 22years and many others, to his deep satisfaction ho also saw the every tiny change of sign in the Sun spot curves can be completely explained by the nature of the movement of the Sun about the SSCM. It appears that maximum Sun spot production occurs at times of maximum rate of change of velocity and roll of the Sun whether it be positive or negative. In simple terms it seems that the Sun is acting like a dynamo so that more rapid shearing of the magnetic flux lines equates to more Sun spot production and of course at little or no change in velocity then we see no spots. This was a great achievement in itself, in his first two books Fred predicted the next 3 Sun spot cycles (and can do so for any time you wish) and stated that there is indeed a missing cycle, since that time evidence for the missing cycle has been found and the date of the start of cycle 24 (now should be 25) was spot on (no pun intended). Both these predictions were made more than two years prior.
When studying his charts Fred suddenly realised that they showed the Sun - Earth distance at any point in the orbit but the astounding realisation was, that this showed the accepted Sun -Earth distance was incorrect because it shows a constantly varying but nonetheless calculable, distance. Of course using these distance changes you can represent them as changes in the energy received by the Earth by simply applying the inverse square law to the TSI figures of 1374W per square metre, large variations from the accepted values were found. To check this out records of Global and regional temperature changes were researched and compared to the charts and again everything fits like a glove, so in both cases Fred discovered a relativlely simple way of both predicting Sun spot production but more importantly, predicting large scale Global and Hemispherical temperature variations because the records agree and as they are related to planetary movements then it is posible to predict with some accuracy.
Fred is finalising the third edition of his book and by about September there will be a Website dedicated to his work. More information or enquiries about the book can be found here http://omniclimate.wordpress.com/2010/02/21/about-frederick-baileys-textbook-of-gravity-sunspots-and-climate/ or by e-mailing Fred at fredbailey@sky.com
Howard Bailey
Sunspot cycles exhibit their
Sunspot cycles exhibit their strongest modulation when Angular Momentum is at its highest. This ALWAYS occurs when Uranus & Neptune are together, this wave is repeatable every 172 years. But the peak of the wave also holds the right conditions for grand minima which can only happen around the peak in Angular Momentum.
I am surprised you are still pushing your fathers incorrect theory of the Earth orbiting the SSB. The JPL coordinates show this to be a falsification..
JPL calculations
Hi Geoff
I must disagree with your conclusions. I have studied the JPL site and it openly admits that two graphs are 'fudged' together to get the results they expect to see and yet still have an unexplained missing component; the reason is of course because their method is not quite right. Fred's work suffers none of this as everything, in great detail, fits perfectly and is why Fred is able to answer and demonstrate how Sun spot propagation works with regard to planetary movements, but he has now moved on to concentrate on the more important secondary discovery of the previously unknown chord length changes between the Sun and Earth. For example, let's look at two points in relation to this work. Point one; Most would agree that the Sun wobbles about the SSB and this is how astronomers find evidence of planetary bodies around distant stars; if as JPL state, the Earth orbits the Sun and not the SSB, i.e. follows the Sun's wobble, then you would expect to see the wobble of the background stars from Earth, you do not see this because, the Earth orbits the SSB, as do all the solar bodies including the Sun. Point two; if you study the graphs of satellites attempting to determine the TSI, you will find many weird and wonderfull reasons are given to 'amend', 'correct', 'compensate' etc. the figures obtained because they EXPECT them to be within a certain range because they believe that the Sun Earth distance is fixed, what they have actually done is to remove the data that my father's work has shown to exist and is backed up by explaining large scale global temperature fluctuations. I will ask my father to get involved with this forum as he is better able to explain his work in detail. I admire your work and tenacity but I believe you will never succeed if you do not take on board what Fred has discoverd.
Challenging JPL
Hi Howard, that is quite a challenge to say the JPL data is incorrect, I know Gerry would disagree with you as he used to work for NASA and guided spacecraft using this data, part of the JPL process is to back up the data with observations. A big statement like the Earth does not orbit the Sun would need to be quantified with some solid data. If you can prove that, science would be over turned.
Challenging JPL
Hi Geoff,
Your last reply brought a smile to my face, I would not put it in quite the way you described but, in essence, what you said is exactly Bailey’s proposition. History is littered with discoverer’s that had a hard time convincing the establishment, that their discovery/idea is a fundamental challenge to the norm. But then of course the ‘norm’ is only so until it gets either modified/added to, or sometimes, completely replaced, in the light of new information. I do not expect Bailey’s ‘Solar Chord Discovery’, as he has recently chosen to market it as, to be anything other than a tough journey.
Taking your point about NASA/JPL using data to guide spacecraft; for the benefit of some readers, let’s look at this in more detail. NASA or anyone else, can not launch a rocket and arrive at a remote location using initial guidance data alone. The projected positions of solar bodies and especially the spacecraft, at any given time, is at best, a close approximation. The fact is, all spacecraft carry data and instruments that measure the position of ‘fixed’ remote stars, in order to more precisely determine its true position in the solar system, this data is then used to make numerous course corrections, in order to arrive at the correct co-ordinates at the correct time. I don’t know about now, but certainly in the Lunar missions, even the relatively ‘short’ trip to the Moon, required mid course corrections. This is not intended in any way, to demean the importance and clever work of Gerry and his colleagues.
Broadly speaking your AM graphs are agreeing with Bailey in the sense that rapid displacements of the Sun, caused by counteracting the movements of all the other solar bodies, is what drives Sun spot production. The difference is in the detail, i.e. the mechanics of solar movements and the interpretation of those movements in relation to the Sun spot counts.
Leaving aside the disagreement about solar bodies orbiting the Sun or the SSB, would you agree, that it appears that Sun spot production, is the net result of ALL the solar bodies gravitational interactions?
If you do, then this explains where the methods used by some to determine a particular aspect of Sun spot production can not produce precise answers, e.g. The article at the top of this thread reads;
“Are Uranus & Neptune responsible for Solar Grand Minima and Solar Cycle Modulation?”
Based on Bailey’s work the answer would be; To a lesser extent yes they are, but to a greater extent, is the effect caused by Jupiter and Saturn, because you have to take into account all the planetary movements to get the complete picture. You can not isolate one aspect and get the correct result. When Bailey studied Sun spot graphs, at all times the comparison was done in relation to the plotted path of the ‘Phantom’ planet mentioned previously, the PCM (Planetary Centre of Mass), i.e. the plotted track of the net result of the gravitational interaction of the four major planets, this method aligned precisely with all the historical data with the exception of the missing cycle, that is why Bailey stated there has to be a missing cycle here, because the plot is a reflection of solar body movements and it is highly unlikely that for some unknown reason, the solar bodies suddenly moved into different orbits at that time then reverted to ‘normal‘, patterns. Of course the other inescapable conclusion was, that if historical data can be verified, then future Sun spot production is predictable because the position of solar bodies is highly predictable.
Why do some state that Sun spots are responsible for climate change? Despite the fact that solar measurements show that Sun spots make very little difference to the TSI (Total Solar Irradiance) figure.
If you accept Bailey’s conclusion that the Earth orbits the SSB, then this easy to explain and correct.
It has already been mentioned that maximum Sun spot production occurs at times of maximum AM, in other words where there is a rapid (relatively speaking) rate of change of position of the Sun, in relation to the SSB. In Bailey’s work, this means that there is a relatively rapid change in Chord Length between the Sun and Earth, which in turn, means an increase or decrease in distance; that results in a rapid change in the total energy received by the Earth and hence sometimes, dramatic climatic changes. So naturally people thought that the Sun spots were responsible for temperature fluctuations. They were unaware, until now!, that Sun spots are an indication of Solar Chord Length variation and hence large varying degrees of energy received by the Earth.
Currently we are in solar cycle number 24 (25?) and this will end in 2016. The PCM track is currently in a long, slow, circular orbit, on average these type of orbits last 10.5years, this situation results in very little Sun spot production because AM is constant. In 2016, the PCM track will be two thirds of the way towards Jupiter’s orbit, at this time Sun spot production will begin in earnest because AM is now increasing; By 2018 it reaches Jupiter’s orbit and by 2020 will be 190 million kms beyond Jupiter’s orbit. This means that in the period between 2016 and 2020, the Sun’s distance from the SSB will double. This will result in the start of a cooler period in the Summer time for the Northern Hemisphere. This was a very similar situation to 1841, when the Franklyn expedition became icebound, in the Summer time, in the Canadian Artic Ocean looking for the North West Passage. This is all part of the recognised 178 year solar cycle, i.e. 15 orbits of Jupiter. Bailey plotted a received wattage chart for this period, based on Chord Length change and discovered that the lowest TSI for that year, occurred in July and this is why the Franklyn expedition failed.
Bailey's books show in great detail, with minimal maths and lots of diagrams exactly how the PCM track (Change in Chord Length) clearly explains phenomena such as, the Medieval Warm Period of 1263 – 1306 and the Maunder Minimum Cold Period of 1660 – 1703. The details are more complicated than this in that there are times when it is a global change and times when it is predominantly a Northern or Southern hemispherical change only. So just like the sunspot cycles, the solar energy received can be predicted by plotting the future PCM tracks with a high degree of accuracy. We must of course bear in mind that the matter of local changes in weather patterns is an entirely different and very complicated discipline but at least now the climatologists can use the correct wattages in their climate modelling computer runs.Apart from all these explanations let’s not lose sight of a simple fact, in relation to Sun spot production and climatic changes, based on his work, Bailey has made precise predictions, two of which have since been confirmed, who else has/can do the same?
Data needed
Hi again Howard,
I appreciate your determination, but you have a world of data needed to justify your family claims. Proposing such a claim demands secure data that so far is not forthcoming. Solid data has to be provided supporting your claim the Earth orbits the SSB which I am severely skeptical can be achieved.
JPL tells us the small elliptical orbit of Earth varies by 15,000 km. The Sun can move 1.5 million km from the SSB, that adds 3 million km to our already elliptical orbit if we go on your theory. There are many satellites that are balanced between the Sun/Earth gravity point measuring solar output that allow for the small differences in the Earth/Sun distance, their results would not be quantifiable going on your theory.
The ball rests in your court....you will need to provide solid evidence.
Useful Animation
Howard and Geoff,
I am no scientist and I am not going to get involved in this debate anymore than to give you a video link which suggests that the Sun AND planets orbit around the SSB: http://www.youtube.com/watch?v=1iSR3Yw6FXo&feature=related
SSB
A useful animation that displays the solar path generated by the gas giants, but it does not offer any evidence of the orbit axis point of the solar system planets.
The Sun moves around the SSB because of gravitation forces exerted from the planets. The same forces dictate the planets must orbit the Sun. I have researched this in great detail and have yet to come across any evidence that supports any planet orbiting the SSB. Having said that I would be extremely interested to be shown otherwise with scientific data as it would open a Pandora's box in relation to spin orbit coupling.
Implications if theory correct
I suppose it doesn't provide any such evidence, but does this new idea jeopardise the planetary theory, Carl's graph or the prediction of future solar cycle modulation? In my opinion, it only challenges our knowledge of solar-terrestrial relations. Please, correct me if I'm wrong. Definitive data, as you say, would validate the theory. Here is another video made by the same people about the Earth-Moon Barycenter if you want to take a look: http://www.youtube.com/watch?v=uGBANgbRkws
Obviously I have no idea who's right, and I don't doubt anyone's expertise.
Oh! And here's another
Oh! And here's another video using Celestia software showing the sun's wobble and the orbits of Mercury, Venus and Earth following the sun's wobble: http://www.youtube.com/watch?v=_IHXj8k2jqc
Obviously it doesn't provide any evidence or data, but it contradicts the other video.
Youtube
Youtube video can be very unreliable. But if anyone can challenge JPL Horizons data and be successful, it will make front page.
Barycenters
There is a website here which states that each planet has its own Barycenter system with the sun, and that the Earth-Sun Barycenter is "well within the body of the sun". Jupiter's is 28,000 miles above the surface of the sun. http://www.applet-magic.com/centermass.htm
Another website saying a similar thing (but for kids!): http://spaceplace.nasa.gov/en/kids/barycntr.shtml
Location of SSB
So, based on that, where is the SSB? Would it be central to all the planet-sun barycenters, probably closest to the Jupiter-Sun Barycenter? Or where the centre of the sun would be if nothing at all was orbiting it?
Position of the SSB?
Yes each planet has its own planet/Sun barycentre point, because they revolve around the Sun or this would not be possible, just as the Earth & Moon share their own barycentre point with each other. As the Earth moves around the Sun the Moon is taken with it, this is no different to the Sun/planet system only that more players ae involved. The SSB is a mathematical point calculated as the central point that the Sun orbits around on its loopy changing path. The path is determined by the combination of the planet positions at the time. The SSB (solar system barycentre) is the intersection of the red lines, the yellow circle is not the position of the Sun, it is just to show the relative size. The centre of the Sun is travelling on the loopy line.
Well that solves it!
Thanks for your patience. This seems to demolish the theory that the planets orbit the SSB, so do real-life observations and calculations.
Mathematical evidence of Frederick Bailey's Theorem
Hi Geoff
You asked for some evidence about Bailey’s work. Please let me try and explain the proposal, for the moment only in relation to sunspot production and correct a mistake I made in my previous reply.
I stated; “Broadly speaking your AM graphs are agreeing with Bailey in the sense that rapid displacements of the Sun, caused by counteracting the movements of all the other solar bodies, is what drives Sun spot production.”; Having studied the AM method and Bailey’s work more closely, this statement is not correct, apologies and I will now explain why.
The original thought was, what is the actual configuration of the solar system as it fly's along the Galactic track? Newtonian laws were chosen to explain the forces involved; the following is a detailed description of the methodology used;
The Solar System is so remote from any other influencing group; such as the star Proxima Centauri, its nearest neighbour; that it is considered as isolated from the point of view of gravitational interactions.
This means that the group acts as a coherent group. i.e., all reactions are restricted to the group and all the forces resulting from these reactions are resolved to zero at any point in time in relation to a given point located within an established Newtonian Inertial Frame of reference.
In essence, what this means is, if we freeze frame the action at any point in time and take measurements within this frame of reference, determining the location of all the nine stationary objects, both in distance and three dimensional direction, such that we have a vector force of mass for each of the objects, in relation to the selected given point within the frame of reference, it will be found that all the forces will cancel out and resolve to zero.
This means that the group’s common centre of mass will not deviate from its original vectored track relative to the inertial frame selected point of reference.
Common sense dictates, that, if one has got to designate a point of reference within the Newtonian Inertial Frame, then why not locate it upon the line of flight of the Solar System centre of mass. ( R = 0 )
That way, when all the calculations are made, the final product result, of zero, will be at the physical centre of the group, further more, for the group to remain stable and the maths to work, the ecliptic plane must lie at 45 degrees to and square across the flight path.
The Law of Conservation;
In a system considered as totally isolated, Newton’s laws of motion show that the total momentum of the system remains constant. All the forces acting within the group, which can be separated out into individual pairs of equal and opposite forces, means that there is no change of momentum between the two bodies in question. Therefore, because the effects of these separate forces are additive, no change of momentum of the whole group takes place.
The centre of mass of the whole group obeys Newton’s first law of motion, by remaining at rest relative to the frame of reference or moving at constant speed, as long as there is no external force brought to bear upon the system.
As all the bodies in this system are basically spherical in shape, it is quite in order to consider each body’s mass as concentrated at a single point; its centre.
Conclusion;
It can be seen from this, that the idea that the Earth follows the Sun as it orbits the solar system centre of mass, the SSCM, would totally negate the laws of Newton.
The summation of the forces under this principle would not resolve to zero. The idea that one can negate the Earth’s force that accelerates the Sun by invoking two separate rules, one for the Sun / inner planets and one for the Jovian group is mathematically impossible.
All the bodies are interacting with one another at every instant of time. At times, the Sun’s attraction upon the Earth and the Earth’s attraction upon the Sun are being apposed, and at other times is being assisted, by different groupings of all the bodies involved.
The real time acceleration of these two bodies, and all of the others, is the summation of the group.
So, let’s put this into diagrammatic form; Note:- Apologies that I am unable to load decent images of the diagrams, so there are thumbnail images with links to a better image that can be viewed and or printed/down loaded for a better view.
Figure 1 shows the forces involved for any solar body moving in the plane of reference (In this case the Sun);
For a clear picture please go here:- http://i819.photobucket.com/albums/zz120/Howardsway/Forces.jpg?t=1281987879
Notes: SSCM = Solar System Centre of Mass. PCM = Planetary (group) Centre of Mass, which is why the Sun is shown to the West of the SSCM.
Figure 2 gives the view for the whole group, excluding the minor planets, as they make little difference to the results.
Big Picture link:- http://s819.photobucket.com/albums/zz120/Howardsway/?action=view¤t...
Figure 3 shows how all the solar bodies move as a group; Note that this can only be stable if there is forward motion, I will explain the significance of this later.
Big picture link:- http://s819.photobucket.com/albums/zz120/Howardsway/?action=view¤t...
Let’s discuss in more detail what we have so far;
Figure 1 shows that there are two fundamental factors involved in maintaining a stable configuration, one is the balance of AM and the other, is the rate of change of V, along the track.
The component in the third direction, i.e. Velocity, is the whole crux of Bailey’s work and I will now attempt to show how AM on its own, can not explain sunspot production, whereas, V, completely explains the shape and size of the sunspot curves.
What is so important about V? Figure 2 shows that any solar body above the East - West line, is above, behind and under constant acceleration, whereas anything below, is below, in front and under constant deceleration.
This is a difficult concept to grasp at first, so let’s look at Neptune’s orbit;
Look at the arrow head just below Neptune in Figure 2. As Neptune reaches this point, acceleration is just about to change into deceleration inside the Southern sectors, so at this point, Neptune has attained its greatest forward velocity and its momentum allows Neptune to overtake the SSCM that is moving at a constant velocity.
As it goes down and in front of the SSCM, gravity now pulls it back towards the SSCM, gradually slowing it down until, at the Southern axis, for a brief moment, Neptune’s forward velocity matches the SSCM, thereafter, Neptune continues to decelerate until the SSCM catches it up again and at the Eastern axis, Neptune is now at its least forward velocity and falls back, above and behind, into the Northern sectors. Now gravity begins to accelerate Neptune until at the Northern axis, for a brief moment, Neptune matches the velocity of the SSCM before continuing to accelerate back towards the SSCM, where at the Western axis, off we go again……..
It is this constant balance of the solar bodies above and behind the SSCM, exactly matched by the solar bodies below and in front of the SSCM, together with the corresponding match in AM, which provides a stable configuration. (Does this explain the missing spin orbit coupling? What do you think?).
Now we come to a very fundamental observation; In relation to the inclined Ecliptic plane, any solar body moving in an East – West – East direction is experiencing some rate of change of AM, whereas any solar body moving up and down the plane is experiencing some rate of change of velocity, i.e. acceleration or deceleration.
So lets pull all this together and show how V and not AM, explains sunspot production.
Figure 4 shows the PCM track (Planetary Centre of Mass) which is a mirror but to a larger scale, of the Sun’s orbit about the SSCM, for the period 1945 to 1956.
Big picture link:- http://s819.photobucket.com/albums/zz120/Howardsway/?action=view¤t...
Notes: The shaded areas show where the Sun is pointed towards the Northern or Southern Hemisphere, with the white areas being the Equatorial areas. (Not relevant to sunspot production).
Figure 5 is a (bad) reproduction of sunspot curves with a difference, the difference is the shaded black and white areas, these denote where the Sun passes the East – West axis, i.e. from Acceleration above, to deceleration, below the axis.
Big picture link:- http://s819.photobucket.com/albums/zz120/Howardsway/?action=view¤t...
In Figure 4 concentrate on the period 1949 to 1952, notice how the track passes from acceleration (above the axis) through deceleration (below the axis) and back to acceleration (Remember the Sun’s track is a mirror image of this) and this is reflected in Figure 5 by the change of colour. Also, in the space of three years, the Sun swings through a massive AM change of about 190 degrees, but, notice that this does not result in large sunspot production, rather the reverse, the count is rapidly dropping. Why? The reason is you will also notice that although there is a rapid change in AM, there is a small change in V, up and down the plane, it is rate of change of V that produces sunspots, or not.
Now, if you look at the three years period from 1952 to 1955, you will see the opposite effect.
There is a rapid deceleration of the Sun but a small change in AM, the result is a large spike of sunspot production.
It was found that this behaviour completely matches the shape and amplitude of the sunspot graphs and convincingly shows that rate of change of V determines sunspot production.
Here is another discovery from this work;
Figure 6 shows past and future, sunspot cycle changes.
For some reason I cannot fathom at this time, i.e. understand the maths (perhaps someone could help me here?), they all fall along the NE – SW and NW - SE axis’s. This is (partly) how Bailey was able to predict cycle 24, 2 years ahead of NASA and find the missing cycle (since verified by a found document details here http://arxiv.org/abs/0907.0063 it is headed, “A solar cycle lost in 1793–1800: Early sunspot observations resolve the old mystery”.)
Big picture link:- http://s819.photobucket.com/albums/zz120/Howardsway/?action=view¤t...
There are other aspects of this work that enable cycle times to be determined.
This is a small example of the mass of information gleaned over the past 8 years or so and I hope this gives you some idea why I am so convinced that this work is on the right track with more to come.
In the next couple of weeks a dedicated web site will be launched, to fully explain the concept.
All diagrams are Copyright of Frederick Bailey and are reproduced with his permission.
Thanks Howard
Thanks Howard, your fathers theory on the fluctuating galaxy orbit speeds of the Sun & planets is interesting but it will need solid data to back it up. It is flying in the face of JPL and maybe will challenge Kepler as well. He is talking about a chord length change that is not tied to the elliptical path. Chord length changes require a trade off to conserve angular momentum, which is normally planet velocity changes. These are all accounted for and observed via Kepler but maybe the door is open for a rotation change of one of the bodies.
The big problem is to demonstrate how the bodies change their galactic velocity....it seems impossible right now.
Easy Sunspot Cycle Prediction
Hi Geoff
In my last posting, which I am perplexed to see has lost a lot of the wording for some reason? I put forward Bailey’s theory for showing how planetary movements determine the shape and amplitude of the sunspot curves.
No doubt you will have noticed that the last diagram shows a plot of the past and the next 14, sunspot cycle dates up to the year 2163.In this posting I would like to share exactly how this has been achieved, albeit in a much condensed and simplified manner, you will see that once you know the pattern, forecasting is simple!!
The pattern was discovered by studying the link between the tracks of the PCM (Planetary Centre of Mass), SCM (Sun Centre of Mass) and the orbital characteristics of the four major planets.
The inertial frame of reference is the same as previously described.
Figure 3 shows the PCM track from 1975 to 2006 but notice how certain dates have been highlighted by showing them as larger black dots
The large black dots are the positions of the Solar Cycle Minimums for 1944, 1954, 1965, 1975, 1986, 1996, 2006 and 2016 to complete one set of pairs in each quadrant.
Note: 1944, 1954, 1965 and 2016 were added to complete the cycle sets but without their track lines shown, to prevent cluttering of the track shown (1975 to 2006).
Immediately you will see that each cycle rotates one quadrant at a time in a clockwise direction, that happens to be opposite to the movements of the PCM and SCM tracks in our plane of reference.
Another interesting find is that the angular shift of the SCM alternates every other cycle from 360 degrees to 270 degrees.
By combining these two facts it enables us to produce the next table, Annexe 01, where you can now clearly see the simple repeating pattern of Solar Cycles up to the year 2174.…and so on…….This is the pattern everyone has been looking for.
Solar Cycle Minimum Periods 1902 to 2174 Annexe 01
PCM | Time Period & | Rotation | SCM | Cycle |
Quad. | Cycle Number | Angle | Quad. | Years |
SW 1902 - 1913 14 360 NE 11
SW 1913 - 1923 15 270 NE 10
NW 1923 - 1934 16 360 SE 11
NW 1934 - 1944 17 270 SE 10
NE 1944 - 1954 18 360 SW 10
NE 1954 - 1965 19 270 SW 11
SE 1965 - 1975 20 360 NW 10
SE 1975 - 1986 21 270 NW 11
SW 1986 - 1996 22 360 NE 10
SW 1996 - 2006 23 270 NE 10
NW 2006 - 2016 24 360 SE 10
NW 2016 - 2028 25 270 SE 12
NE 2028 - 2038 26 360 SW 10
NE 2038 - 2048 27 270 SW 10
SE 2048 - 2059 28 360 NW 11
SE 2059 - 2068 29 270 NW 9
SW 2068 - 2079 30 360 NE 11
SW 2079 - 2089 31 270 NE 10
NW 2089 - 2101 32 360 SE 12
NW 2101 - 2109 33 270 SE 8
NE 2109 - 2121 34 360 SW 12
NE 2121 - 2130 35 270 SW 9
SE 2130 - 2143 36 360 NW 13
SE 2143 - 2151 37 270 NW 8
SW 2151 - 2163 38 360 NE 12
SW 2163 - 2174 39 270 NE 11
F Bailey 2001
This is principally how Bailey was able to predict the start of cycle 24, 5 years ahead (notice that Annexe 01 is dated 2001) of anyone else and determine the ‘missing cycle’.
Above I mentioned the orbital characteristics of the four major planets.
The following table shows the Orbital Times and Progression Angles.
Orbital Time (years) Progression Angle (degrees)
Jupiter 11.86 30.354
Saturn 29.46 12.22
Uranus 84.00 4.286
Neptune 164.80 2.184
The well known climate cycle of 178 to 180 years is brought about by all the matter that orbits the SSCM (Solar System Centre of Mass) with the main contenders being the four largest planets and the Sun.
There are 15 Solar Cycles (Sun orbits) and 17 sunspot cycles in this period.
This is equal to 15 orbits of Jupiter and with the average sunspot cycle being 10.5 years this gives us 17 sunspot cycles. This also gives us the double sunspot cycle period of 21years that is reflected in various records.
Now if we look at the relationship between the planetary orbit times and the 178 period, a curious pattern emerges as follows;
Jupiter 178/11.86 = 15
Saturn 178/29.6 = 6
Uranus 178/84 = 2 (very nearly)
Neptune 178/164.8 = 1 (very nearly)
It is this 1:2:6:15 ratio that dictates the Solar Cycles, the Sunspot Cycles, shape of the curves and the ever changing distance (Solar Chord length) between the Sun and Earth, which in turn leads to the variations in the TSI received by the Earth, but that’s another story!!
It also tells us why the Solar Cycle positions alternate between 360 and 270 degrees. If you want to know how, please read the book.
I have studied the various web sites and discovered why the published TSI figures do not agree with Bailey’s predictions.
Currently and for some time now, no one continuously measures the TSI, what various groups measure, is the difference or variation in solar output and as expected, this only varies by about 0.1%.
They then apply this to the standard figure of about 1368W per Sq. Metre and for any particular time and place on or in orbit of the Earth, make calculations to adjust the figure to take into account the angle of the Sun, the distance, which is always assumed to be somewhere within the 1AU of the Earth’s orbit, atmosphere, etc. to arrive at a final figure.
If TSI per se were to be measured continuously, relatively vast variations would be found and more importantly, would match the historical climate records and show that at times, that climate variation is highly regional in nature, again this is reflected in various sedimentary and other historical records.
Bailey’s books give full details of these findings and in about 2 weeks time, a dedicated web site is to be launched, www.solarchords.com , as a general forum to explain and discuss Solar Chord Science and related subjects.
I hope, Geoff and your readers, that you have found this interesting enough to justify further detailed investigation of this compelling proposal and the more important discovery of the Solar Chord Length variations that are ultimately responsible for large scale climate changes.
Howard Bailey
"Currently and for some time
"Currently and for some time now, no one continuously measures the TSI, what various groups measure, is the difference or variation in solar output and as expected, this only varies by about 0.1%.
They then apply this to the standard figure of about 1368W per Sq. Metre and for any particular time and place on or in orbit of the Earth, make calculations to adjust the figure to take into account the angle of the Sun, the distance, which is always assumed to be somewhere within the 1AU of the Earth’s orbit, atmosphere, etc. to arrive at a final figure.
If TSI per se were to be measured continuously, relatively vast variations would be found and more importantly, would match the historical climate records and show that at times, that climate variation is highly regional in nature, again this is reflected in various sedimentary and other historical records."
This is incorrect. The absolute value of TSI is measured continuously and with great precision. And shows a sinusoidal pattern [variation 7% - largest in January] through the year because of the varying distance to the Sun. This absolute TSI is what is important for climate. If we want to know what the Sun puts out we must compensate for the varying distance. When we do that, we find a solar cycle variation of 0.1%, some 70 times smaller than the yearly variation.
TSI Measurement
Ref. Isvalgaard's comments about absolute TSI measurement. I would be grateful if you could point me to where I may read about the methodologies being used by such as NASA, JPL etc which record absolute TSI. Thank you
TSI determination
Hi Isvalgaard
Thank you for your reply. I would be very interested if you could supply me with the links to sites that show what you say, as the links I found suggested that the 'continuous' reading is an amalgamation of several sources, ACRIM, PMOD etc. with various compensating factors applied. The details of the instrumentation etc. are very complicated and technical, this leads to a certain amount of 'difference' between the various methods used. I would ideally like to see any examples of the raw data, i.e. the actual figures obtained before manipulation.
Between 1902 and 1957, Charles Abbot et al made thousands of measurements of TSI from mountain sites. Values ranged from 1,322 to 1,465 W m–2, which encompasses the current estimate of 1,368 W m–2. These ranges fit very well with Bailey's findings.
You will have noticed in my preceding posting the sun spot cycle prediction table and the method used to obtain it; this table and method will either go down in history as a 'eureka' moment or a complete flop, you know what my view is !, so far it is spot on.
The method was first tested by reproducing historical records and when that proved to be correct, then to predict as far ahead as you wish (within reason).
This work led to the discovery of the varying Solar Chord length (Earth - Sun distance) because using Newtonian Laws, maths dictate that ultimately, every bit of mass orbits the SSB (Solar System Barycentre).
I agree with your figures of the Solar variation, 0.1% and the orbital variation of 7%. I also agree that it is the Earth's elliptical orbit that gives rise to the 7% variation. Where we diverge is that Bailey is saying that the Earth orbits the SSB (Solar System Barycentre) and not the Sun, this means that almost constantly, the meanderings of the Sun about the SSB now become and additive or negative factor to the Solar Chord length and hence the TSI. This should show in current readings but does not appear to do so. This is the only aspect of the Solar Chord Science relationship that is hard to pin down. My suspicion is that the raw data is being over adjusted because researchers unquestionably believe that the Earth orbits the Sun.
Why do I say that?
Bailey's extensive study of the PCM Track (Barycentre of the Jovian planets) where Solar Chord Length variations were translated into the corresponding wattage variations, convincingly proves that the Solar Chord length variations are what drives large scale climate changes, I am talking about the order of 17 - 20 times bigger than any other Solar forcings currently discussed e.g. Sunspots, Faculae, Cosmic Radiation etc.
These wattage figures, sedimentary evidence, specific events e.g. the Medieval warm period, the Maunder Minimum period and other events, all agree far beyond anything that statistical methods could show.
Let's bear in mind that we only have to go back to pre-industrialisation times i.e. a 100 years or so, and the whole question of AGW, TSI etc is irrelevant because climate change was unquestionably due entirely to natural causes. This is why I am not perturbed about the apparent difference, rather curious as to why it is so because it does not fundamentally undermine anything in relation to the Solar Chord Science findings.
Since the Solar Chord Science method has proven to be remarkably accurate with historical data, then the logical deduction was, that there must something going on with current measuring techniques of TSI to account for the difference.
The back calculations on wattages are based upon planetary positions, therefore the figures for present and future changes are able to be determined because planetary characteristics are highly predictable.
riesI agree with your figures
riesI agree with your figures of the Solar variation, 0.1% and the orbital variation of 7%. I also agree that it is the Earth's elliptical orbit that gives rise to the 7% variation. Where we diverge is that Bailey is saying that the Earth orbits the SSB (Solar System Barycentre) and not the Sun
Right here is where your argument falls down. The orbital variation of Earth has to be greater than 7% from the Sun if the Earth orbits the SSB.
EDIT: TSI varies by 7% over the year but the orbit varies by only 3%.
Critical Point
Hi again Geoff
Re. your, “Right here is where your argument falls down.”
This depends upon your point of view, this sentence can be applied either way,
i.e. If Solar Chord Science is wrong or TSI determination is wrong.
and your, “The orbital variation of Earth has to be greater than 7% from the Sun if the Earth orbits the SSB.”
I am heartened to see that you get my point of view even though you do not agree with it.
Sun spots and Solar Chord Science (SCS) overlaps and interfaces with many related disciplines covering large time scales , the chronologically new TSI science just being one of them.
The sun spot model gives a more than credible explanation for the controlling mechanism of sun spot production, including the detailed expose of the relationship between the changes in Velocity and AM, to fully explain the shape and amplitude of the sun spot count, this in turn gives credence to the validity of the follow on work in relation to Solar Chord Length variability.
Extensive work in SCS is highlighting many aspects that correlate precisely with historic climate changes and can convincingly show a practical model that explains specific events e.g. The Medieval Warm Period and The Little Ice Age. More importantly, it gives the ability to forecast climate changes. Just because I find an anomaly with TSI, does not mean that therefore SCS should be just summarily dismissed. Logic tells me that one or more aspect is being misinterpreted and needs further investigation.
In the name of good science, I am trying to be as objective and unbiased as possible, SCS has alerted me to a fundamental change in the thinking and new possibilities for research into the sciences involving astronomy and climate change.
That said, I have no doubt that future research will modify and tweak the sun spot and SCS models in various ways e.g. the wattage variations may well be scaled up or down, but it will not change the underlying principles.
My research of the new science of TSI determination clearly shows that it is far from being a settled and undisputed source for any solar forcing argument either way,
For instance,
“Recent oppositely directed trends in solar climate forcings and the global mean surface air temperature. II. Different reconstructions of the total solar irradiance variation and dpendence on response time scale”
By Mike Lockwood and Claus Frohlich“We have previously placed the solar contribution to recent global warming in context using observations and without recourse to climate models. It was shown that all solar forcings of climate have declined since 1987. The present paper extends that analysis to include the effects of the various time constants with which the Earth’s climate system might react to solar forcing. The solar input waveform over the past 100 years is defined using observed and inferred galactic cosmic ray fluxes, valid for either a direct effect of cosmic rays on climate or an effect via their known correlation with total solar irradiance (TSI), or for a combination of the two. The implications, and the relative merits, of the various TSI composite data series are discussed and independent tests reveal that the PMOD omposite used in our previous paper is the most realistic. Use of the ACRIM composite, which shows a rise in TSI over recent decades, is shown to be inconsistent with most published evidence for solar influences on pre-industrial climate. The conclusions of our previous paper, that solar forcing has declined over the past 20 years while surface air temperatures have continued to rise, are shown to apply for the full range of potential time constants for the climate response to the variations in the solar forcings.”
This paper concludes that PMOD and ACRIM show opposing global temperature trends yet most other groups state they show a definite upward trend in the past decade.
Conversely, the respected Hadley Climate Centre, with its access to huge computers and thousands of global temperature sensors, shows a graph with a widely fluctuating global temperature range but with a slight cooling trend, despite also showing a slight but steady increase in CO2 levels for the same period.
My confidence in the reliability of the current TSI findings is not high, I also noted that NASA is not prepared to publicise Satellite TSI raw data information.
In any case, as I said before, none of this has anything to do with pre industrial records.
Basic Physics - Earth's Orbit
Throwing in my two cents...
If the solar system were a two body system, with only Sol and Earth, basic physics dictates that both would orbit the Sol-Earth barycenter. With Sol's mass being nearly 350,000 times that of Earth, one could approximate that Sol was remaining motionless while Earth orbited Sol.
Adding large bodies of mass such as Jupiter, Saturn and Uranus to the solar system... obviously, basic physics dictates that Earth's mass must be attracted to these bodies as well. If Earth were to still orbit the Sol-Earth barycenter, something would be amiss - you might as well say that the other planets have magic mass.
The sum of all the local masses attracting Earth's mass can be approximated as a point located at the SSB. So I don't understand why it's controversial to say that the Earth orbits the SSB. F=G(m1m2/r^2), but only between individual planets and stars, and not between the planets themselves? Calculating Earth's orbit in relation to the SSB is still an approximation - the solar system is a gravitational n-body problem.
Re. Basic Physics
Thanks for your input Steve. Stating that the Earth orbits the SSB is controversial and just plain wrong unfortunately. The JPL data is correct and is verified by observations and many sources including the multitude of satellites that need to calibrate their data against the small Earth/Sun variations. I have researched almost every planet through the JPL data and my conclusions suggest they all orbit the Sun. Some with high credentials disagree when it comes to the gas giants.
Earth's orbit is affected by other planets gravity but it is a perturbation of the orbit shape on a minor scale and does not affect the actual orbit point. Each planet I think orbits its own planet/Sun barycentre point, the Sun moves around according to the relevant planet positions. Each planet has to move with the Sun as it changes its position, which is a product of the planet positions.
What Solar AM Implies
Hopefully you also disagree when it comes to the gas giants. Otherwise you would be contradicting your own position regarding solar angular momentum.
When Jupiter, Saturn and Uranus are on the same side of Sol, Sol must move away from all of them (and thus, farther from the SSB) to maintain a stable SSB position. This leads to high AM for Sol - you've graphed it. And the implication is that Sol is clearly moved farther away from the 3 gas giants. If the 3 gas giants kept exactly in step with Sol and also moved in the exact same direction, maintaining a constant distance from Sol, the location of the SSB in relation to Sol wouldn't have changed.
So your own graphs and AM calculations show that when the gas giants are in alignment on the same side of Sol, their distance from Sol must increase. Otherwise the Sol-SSB distance would remain constant, and there would be no solar AM to calculate.
It seems to me that Landscheidt and Bailey are working from the same simple assumption - that the solar system is a stable system, so the SSB must remain stable. For short cosmological periods on the order of hundreds of thousands of years, I don't think this is a wild assumption. By moving Sol in relation to the SSB, essentially by balancing Sol-Jupiter-Saturn-Uranus-Neptune on a stable point, they both contradict the simple notion "the gas giants orbit the sun".
So assume that all of the gas giants have moved to one side of Sol and Earth happens to be on the opposite side. Sol must have moved away from the SSB and towards Earth. You are saying that Earth will remain in the same orbit around Sol and move an equal distance away from the SSB - that the approaching mass of Sol would somehow push Earth away from the gas giants.
Gravitational 'Sense'
Hi Steve and Geoff,
Can I add my two cents to the debate please,
Geoff Re. your, “Each planet has to move with the Sun as it changes its position, which is a product of the planet positions.”
I am sorry but this makes no sense at all because it is self defeating. If the planets are ‘tied’ to the Sun and can only follow it, then how can the planets move away from the Sun in order to change the position of the Sun? this is impossible, as Steve has also pointed out.
There are barycentre’s between any group of two or more bodies in the solar system (within certain conditions) but in the end, they all resolve to one common barycentre, the SSB and everything orbits that point. The SSB is the only point that moves at a constant Galactic velocity (250 km/s) and in a (nearly) constant direction.
At any instant in time the positions of all the solar masses, is the sum of the total gravitational interactions. As far as gravity is concerned, the Sun is just another mass, so nothing ‘dominates’ anything else, everything is where it is because all the masses affect each other equally in accordance with the same laws.
It is the orbit of all the mass, except the Sun, about the SSB, that dictates the position of the Sun in relation to the SSB. This can only arise if the non Sun mass does not only orbit the Sun.
Steve is quite right when he say’s that with all the planets except the Earth, on one side of the SSB, then the Sun must move away to counterbalance those forces and Steve is also correct that the Sun cannot ‘push’ the Earth away, the Earth is where it is, because it is doing exactly the same as the Sun i.e. contributing to the counterbalance of the other planets.
What they are all actually doing is as described above, they are at all times collectively maintaining a balanced system.
The layout Steve described and this explanation make sense (I hope!!), but lets not forget that it does not matter which natural configuration you care to display, the same rules apply.
What I am getting at is, that when the planets are on the same side of the SSB as the Sun, they don’t now suddenly behave as they are only orbiting the Sun.
The laws of Gravity apply all the time!!
Re: Solar AM
Steve and Howard, you are both making the same assumption but not checking the data. The Sun is moved by the relative position of the planets but the planets also move with the Sun. When you look at the actual gas giant data the only variation in the solar distance to planet is that expected from the small orbit perturbations caused by the position of the other gas giants. When you look at the gas giant to SSB distance it clearly shows the big variation as the sun moves away...the planets are following.
The best way to look at the data is to compare the Sun/Planet distance at the same point in their respective orbits. I have done this exercise some time ago in an article on Carl's Blog....check it out.
As mentioned previously if the Earth orbited the SSB the variation in Solar distance would be MUCH larger than the 15000 km's we currently see when measuring the distance at the same point in the orbit. The Earth is closest to the Sun each January, this would not be the case if the Earth orbited the SSB.
But the challenge is in front of you, pick a day in the year and prove that the Sun/Earth distance varies by more than 15000 km's each year. According to your theory the distance should fluctuate by at least 1.5 million km's over a ten year period.
AM Graphs and Orbital Distance - What Patterns Must Emerge
If the planet's are following Sol in lock step around the SSB, how can the solar angular momentum that your sight's graphs show possibly be correct? You are calculating solar AM relative to the SSB. If all of the planets move with Sol, then the position of the SSB moves as well (the SSB is determined by the locations of all the masses). When Sol moves towards/away from the SSB, if the gas giants move with it in lock step then you just relocated the SSB by exactly the same amount that you said Sol moved towards/away from the SSB... so there is no solar AM fluctuation in relation to the SSB. If you were talking about a geometric center - well that's a different story. But you are talking about a center of mass, which is determined by the location of all of the masses. If you are going to say that solar AM increases because Sol moves farther away from the SSB, then the position of the gas giants must denote an SSB where your graphs state that it is - they can't follow Sol by the same distance. You can't have your cake and eat it too.
It seems like it is you who is questioning the JPL data. In your article on spin orbit coupling (http://www.landscheidt.info/?q=node/79) you state "The planet inertial frame calculated from JPL was another surprising result which looks to suggest it is in the barycentric frame rather that heliocentric. For our project we needed to make allowances." When you calculated the solar AM using the barycentric frame, but the planet AM using a heliocentric frame... surprise, you ended up with missing AM! Try calculating both with the SSB frame which the JPL ephemerides already uses.
"But the challenge is in front of you, pick a day in the year and prove that the Sun/Earth distance varies by more than 15000 km's each year. According to your theory the distance should fluctuate by at least 1.5 million km's over a ten year period."
I have yet to see a graph anywhere (including your sight) which calculates the Sol-Earth distance from the JPL ephemerides. I did find a PDF with a graph of Earth-Moon barycenter (EMB) angular momentum relative to Sol (http://semi.gurroa.cz/Astro/Orbital_Resonance_and_Solar_Cycles.pdf) which uses JPL data. Interestingly, this author concluded that the gas giants have SSB orbits while the inner planets have heliocentric orbits, but I couldn't follow his reasoning.
His graph of EMB AM relative to Sol is best viewed on Figure 36, page 28. Of particular interest (to me) is the double-dip at the beginning of 1998 - look familiar? Instead of a deep trough/peak at that time in that year, EMB AM (relative to Sol) remained relatively level for a few months. Which, as we know from physics, corresponds to a relatively stable distance between EMB and Sol for a more than usual period. At the same time in 1999, the same graph shows a deep trough - so Earth's motion around Sol the next January was undergoing a completely different movement pattern (changing distance, quickly). This is all derived from JPL ephemerides!
As I stated, I can't follow the author's logic regarding how the graphs derived from the JPL ephemerides shows that the Earth orbit (and other inner planets) is heliocentric while the gas giants are (solar system) barycentric. I expect a simple elliptical orbit to generate an AM graph that shows exactly one peak and one trough per orbit, corresponding to the two apsides. The author's Figure 36 clearly does not show this - yet he insists this proves heliocentric orbital focus for the Earth-Moon barycenter.
Looking at the author's Figure 34 we see a graph that shows exactly what I expect. Count the troughs between 1980 and 1990... exactly 10! And the same with the peaks - 10 in 10 years (orbits)! What is Figure 36 a graph of? The angular momentum of the EMB with respect to SSB, using JPL data (DE405 and DE406).
The Sun is the Gravitational Centre of the Solar System
Steve, I can see where the confusion lies. The SSB is a fictional point that the Sun orbits around but it only truly represents the centre of the solar system when the Sun is directly over it. The path of the Sun is where the central point of the planetary masses lies which changes every second. The solar SSB charts are recording the angular momentum of the Sun as it is flung around the SSB by the planets. The position of the planets is the important factor even though they (I think) are following the central orbit point of the Sun. I am very confident in the JPL data when it comes to the solar AM, it is cross checked by 2 other sources. The AMP events line up precisely with the isotope records over the Holocene and the solar path as mapped out via Arnholm's Newtonian based path generator matches perfectly.
Inertial frames are another argument and are more important when looking at planet AM. Semi is one I was mentioning about having a different view on the gas giants, but I also don't understand his logic. The planet AM graph in my mind has to show the planet perturbations to be correct. Semi in figure 31 shows the Sun/Earth distance balanced agaisnt the EMB distance, this is not what we need to see. I will make a graph of the EMB/Sun distance soon, which will answer the solar chord argument.
The EMB graph (fig 36) is a great example of how the orbit is influenced by the other planets. The difference is small but the peaks and troughs will line up with the normal elliptical movements along with the planets adding their influence. There is a good example of this in my Jovian AM story. All this to me is solid evidence of the planet orbit axis point. The EMB AM graphs using the SSB as axis point are of little value, calculating AM from a non axis point is almost pointless really, the 10 year trend is just J/S.
The SSB is a Calculated Point
I'm not sure what you mean by saying "the SSB is a fictional point". It is a calculated point (there isn't anything there) but the calculation is real. It is the center of mass of the solar system whether or not Sol is directly over it. When all planets are in conjunction, for example, Sol would be at it's furthest possible point from the SSB. In that case, what do you mean by "it only truly represents the centre of the solar system when..."? The geometric center of all the planets in conjunction with the Sol wouldn't be anywhere near Sol - obviously because Sol would be one point at the end of the line. The geometric center of that line would be halfway between Sol and the furthest planet ( and I still like Pluto ;) ).
So I'm not sure what you think my confusion was - I know exactly what the SSB is. What I don't understand is how you think Sol can pull all of the gas giants with it in lock-step and generate the solar AM graphs you are showing. If both Sol and all the gas giants are moving in the same direction relative to this "fictional point"... the calculation of the location of the fictional point necessarily relocates the point. And since you are saying all of the masses moved in the same direction, the SSB-Sol distance would remain constant, so there would be no solar AM fluctuations to graph.
Your article on Jovian AM directly contradicts what I have read elsewhere (including your spin coupling article). In it you state "It must be noted that the JPL data for each planet uses the Sun centre for calculating distance." According to this article (http://www.cv.nrao.edu/~rfisher/Ephemerides/ephem_use.html) and others, "The origin of the rectangular coordinates [in the JPL ephemeris] is at the solar system barycenter (center of mass) for the sun and all planets, except the earth." Which of your graphs assume that the JPL coordinate system is barycentric, and which assume it is heliocentric? Without that information, I really can't tell what your Jovian AM graphs are showing. Is it AM about the sun, or the SSB?
"The EMB graph (fig 36) is a great example of how the orbit is influenced by the other planets. The difference is small but the peaks and troughs will line up with the normal elliptical movements along with the planets adding their influence."
The difference is not "small". As I pointed out, compare 1998 to 1999. That is a huge variation for what is supposed to be AM graphed about the focus of a simple elliptical orbit.
"The EMB AM graphs using the SSB as axis point are of little value, calculating AM from a non axis point is almost pointless really, the 10 year trend is just J/S."
It would be pointless if it didn't show exactly one AM peak and one AM trough per orbit. But since it does, I have to ask... what does "J/S" mean?
"I will make a graph of the EMB/Sun distance soon, which will answer the solar chord argument."
Thank God. I was afraid I had a lot of JPL downloading and graphing ahead of me this weekend.
New forum topic for further discussion
J/S is Jupiter/Saturn.
I have opened a forum topic to discuss this in a better format. I have produced the graph that you are after.
http://www.landscheidt.info/?q=node/200
Lets work through the issues and try and get some outcomes.